
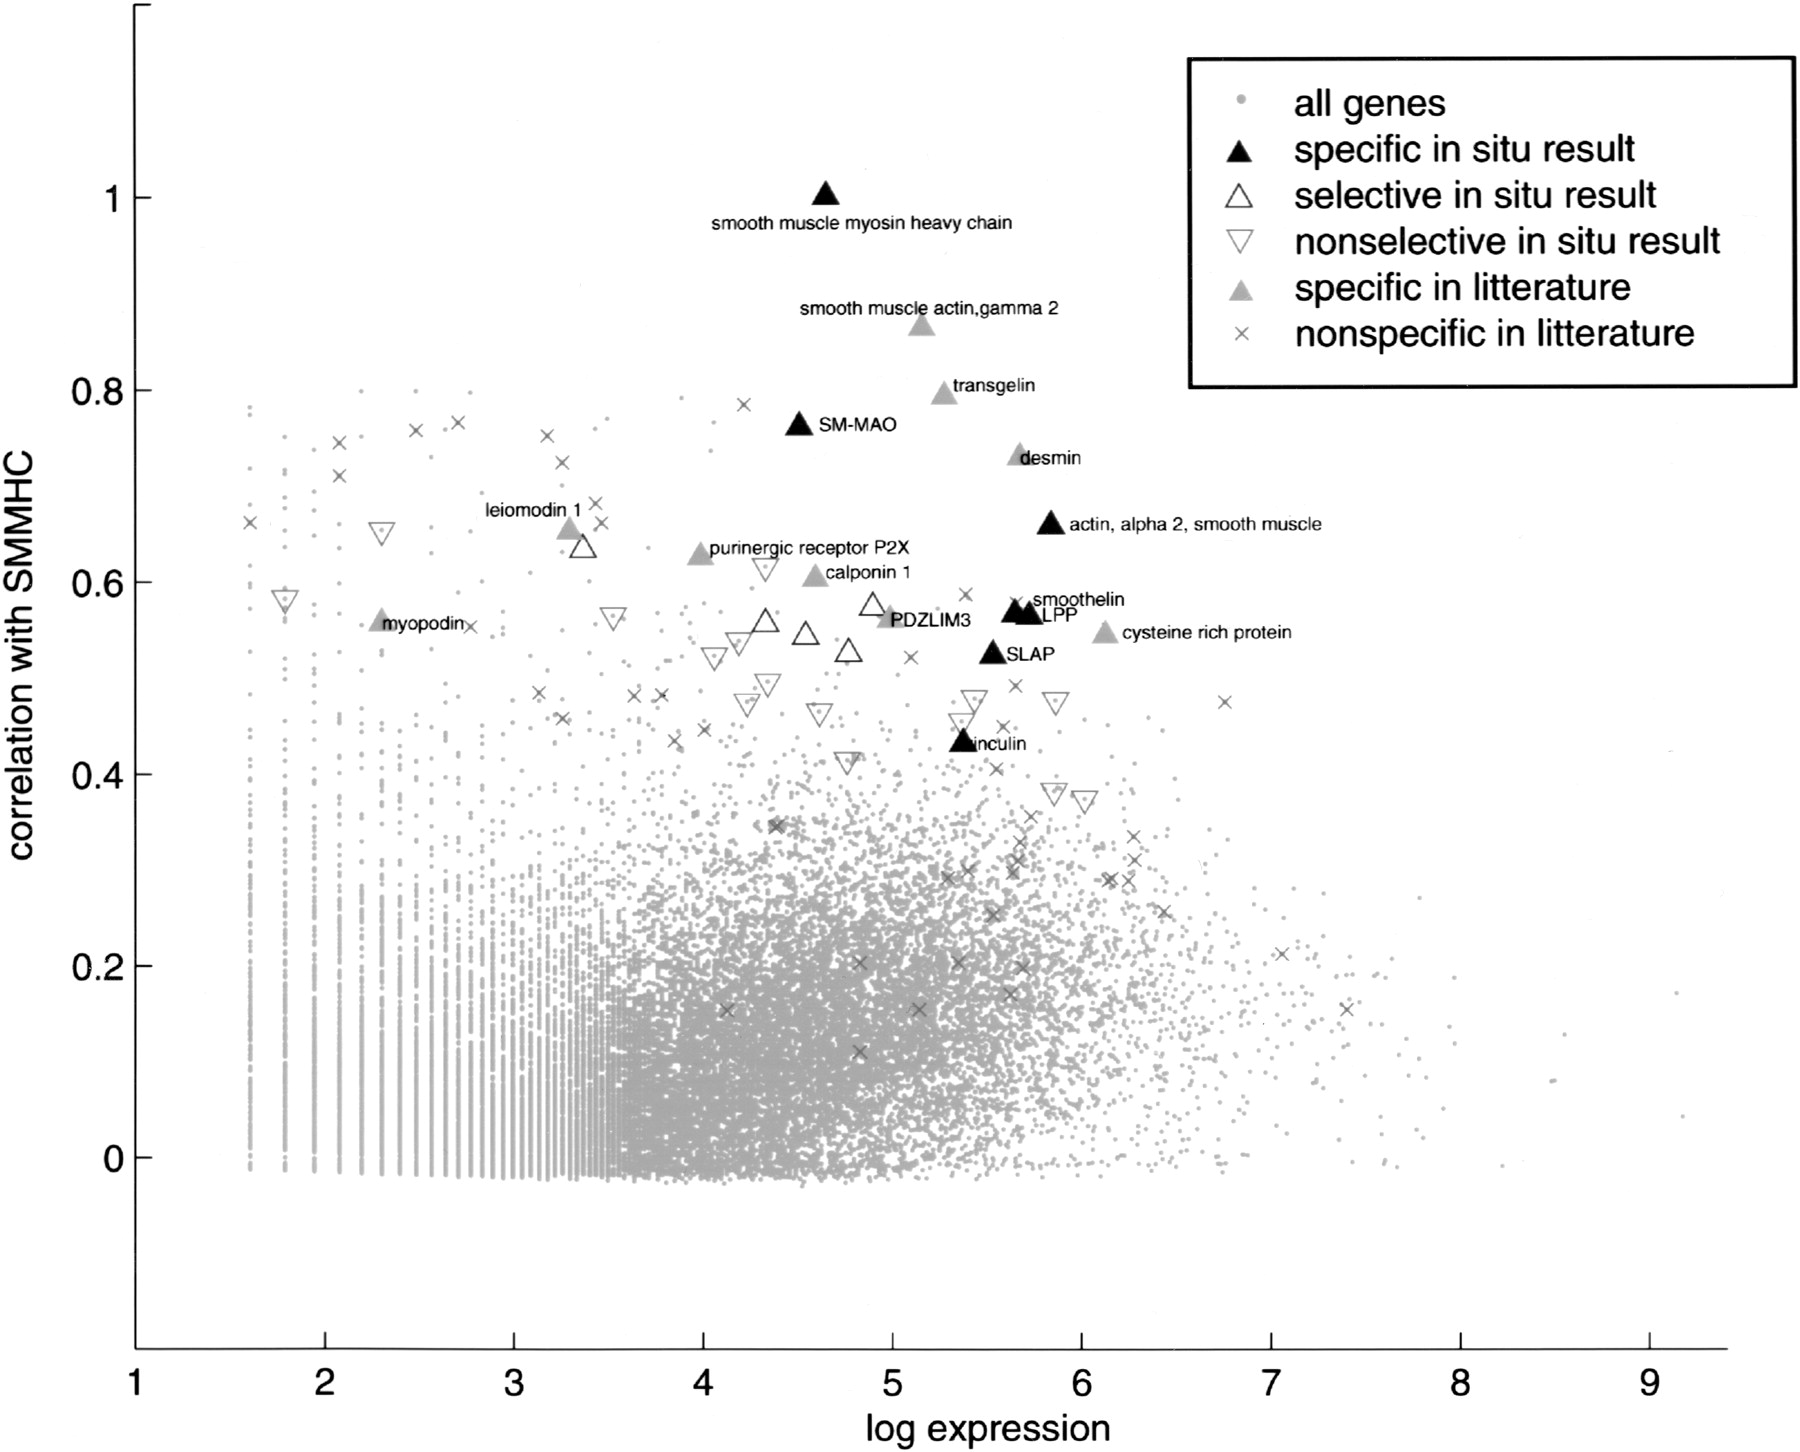
ISH results in relation to profile similarity to SM-MHC (Y-axis) and to expression level (X-axis). Expression level is defined as the logarithm of the number of UniGene detections for a gene, and profile similarity is defined as Pearson's correlation in the raw data set. Gray dots, All 29,812 genes with at least five UniGene detections; dark upward-pointing triangles, ISH-detected SMC markers; open upward-pointing triangles, ISH-detected SMC marker-related genes; downward-pointing triangles, genes with a nonselective expression pattern in the ISH experiment; grey upward-pointing triangles, SMC markers from the literature; crosses, nonselective genes from the literature.


