
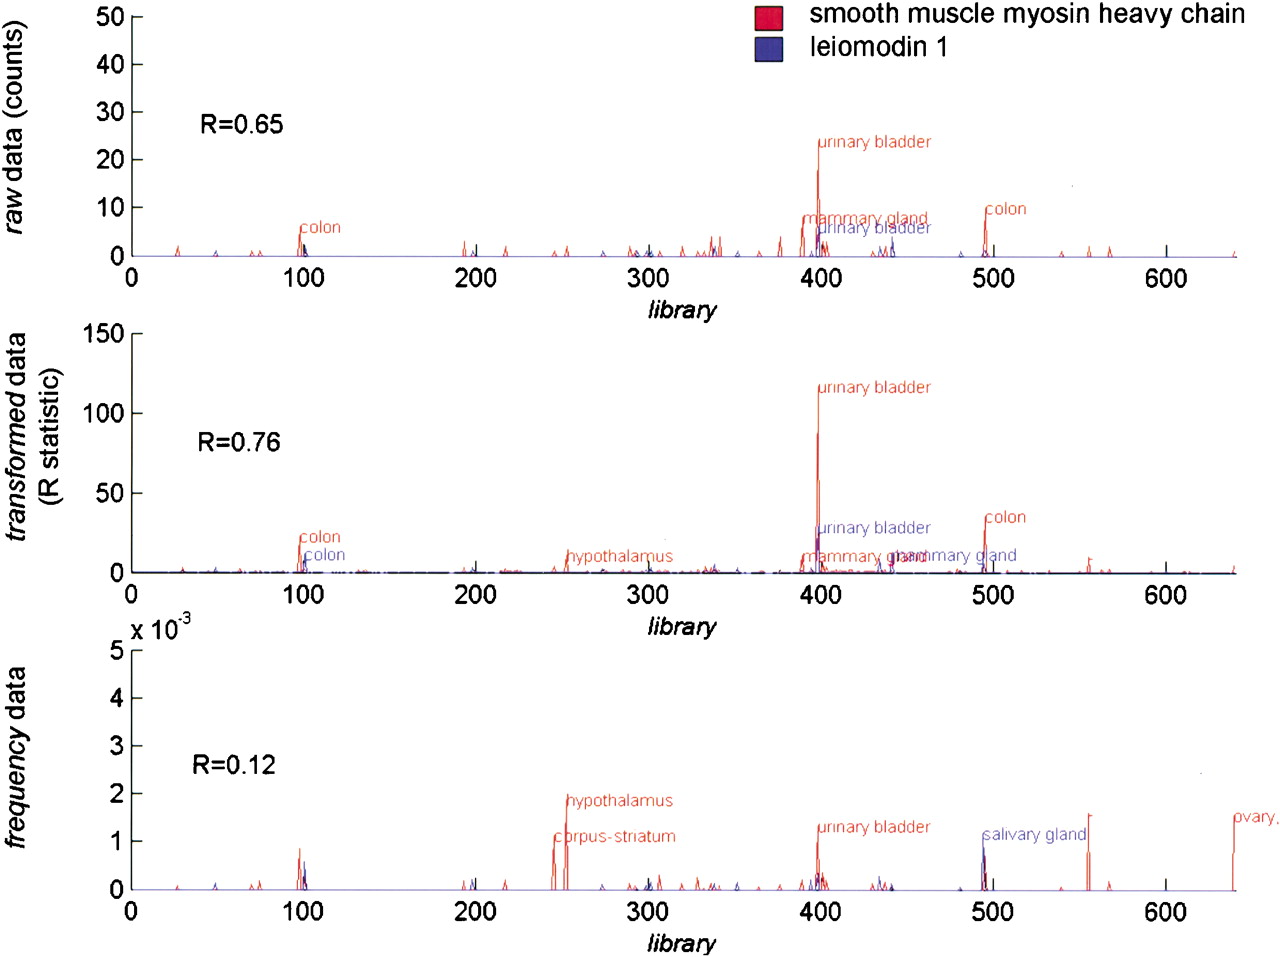
Figure 2
Examples of EST-derived expression profiles for two SMC-specific genes: SM-MHC (103 detections in UniGene, red curve) and leiomodin 1 (28 detections in UniGene, blue curve). X-axis, The 639 mouse EST libraries in arbitrary order; Y-axis, EST-derived expression profiles according to definitions in Methods. For the raw and transformed profiles, the two SMC-specific genes have related profiles (correlation 0.65 and 0.76, respectively). Transcripts are primarily detected in certain urinary bladder and colon libraries. The two genes do not correlate in the frequency data, which also contain signals from unexpected organs such as the hypothalamus.


