
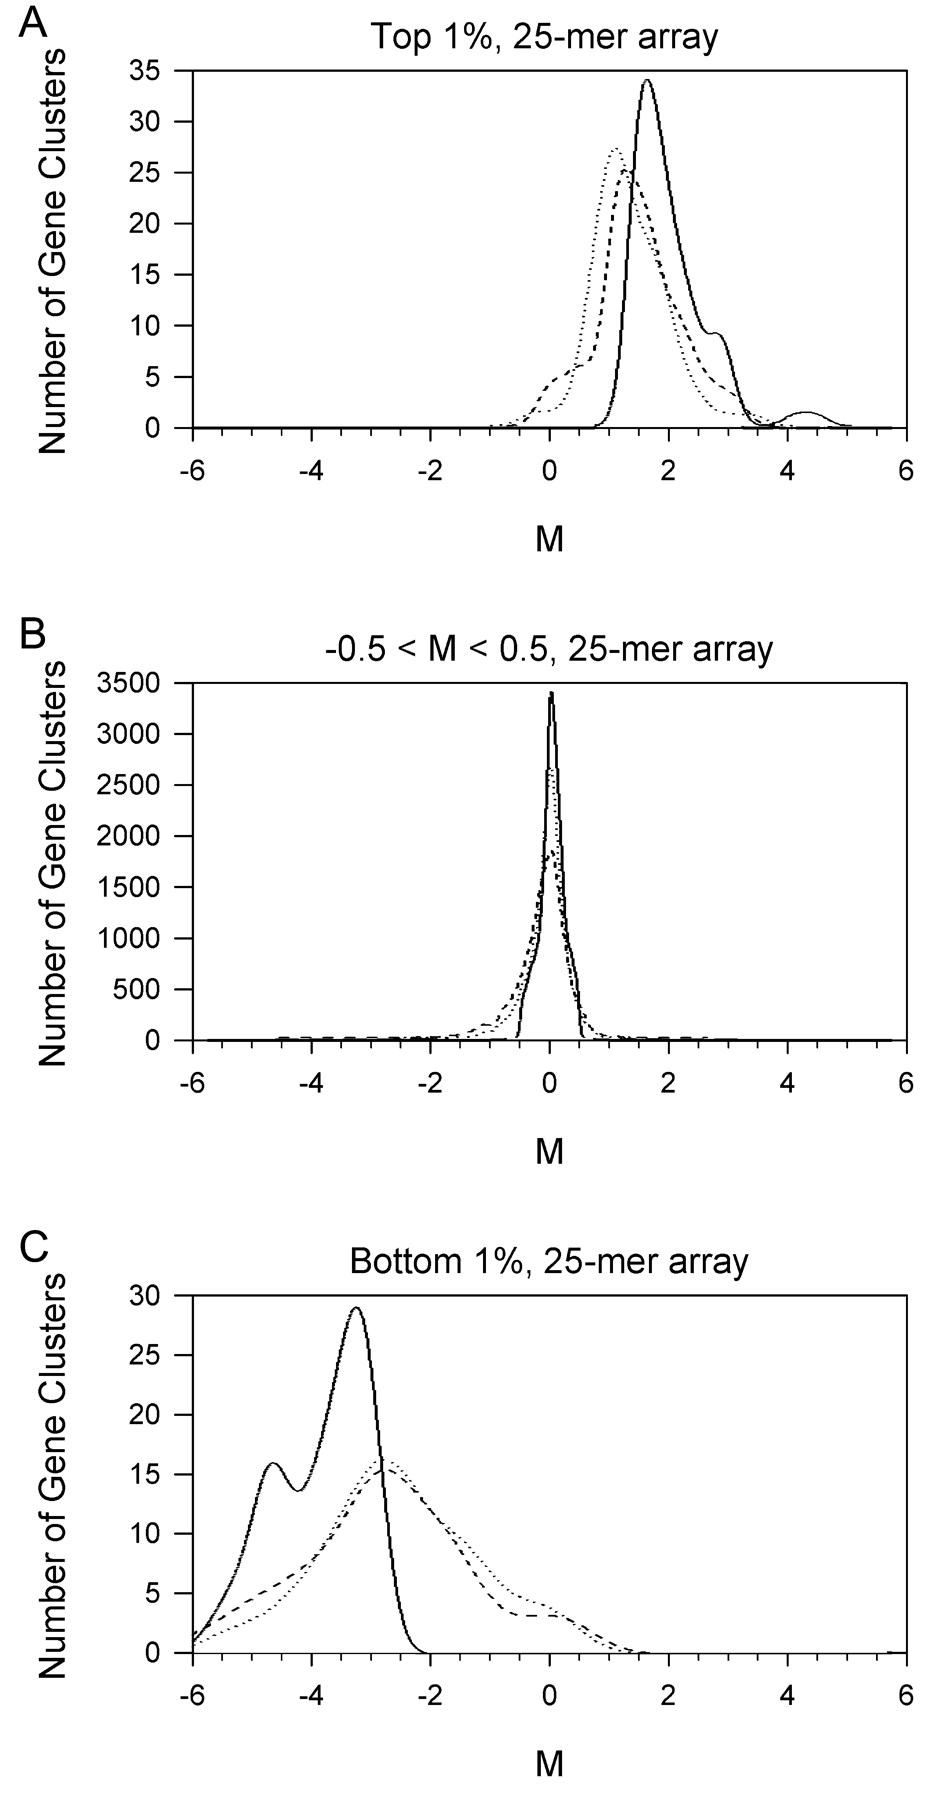
Figure 5
Differential expression measurements for genes with the highest and lowest M values on 25-mer arrays. Genes were divided into subsets according to the M values determined on 25-mer arrays. (A) Genes with M values in the top 1%. (B) Genes with M values close to zero. (C) Genes with M values in the bottom 1%. Each panel shows M values for these subsets of genes as measured using 25-mer arrays (solid lines), Version 1 long oligonucleotide arrays (dotted lines), and Version 2 long oligonucleotide arrays (dashed lines).


