
Figure 4
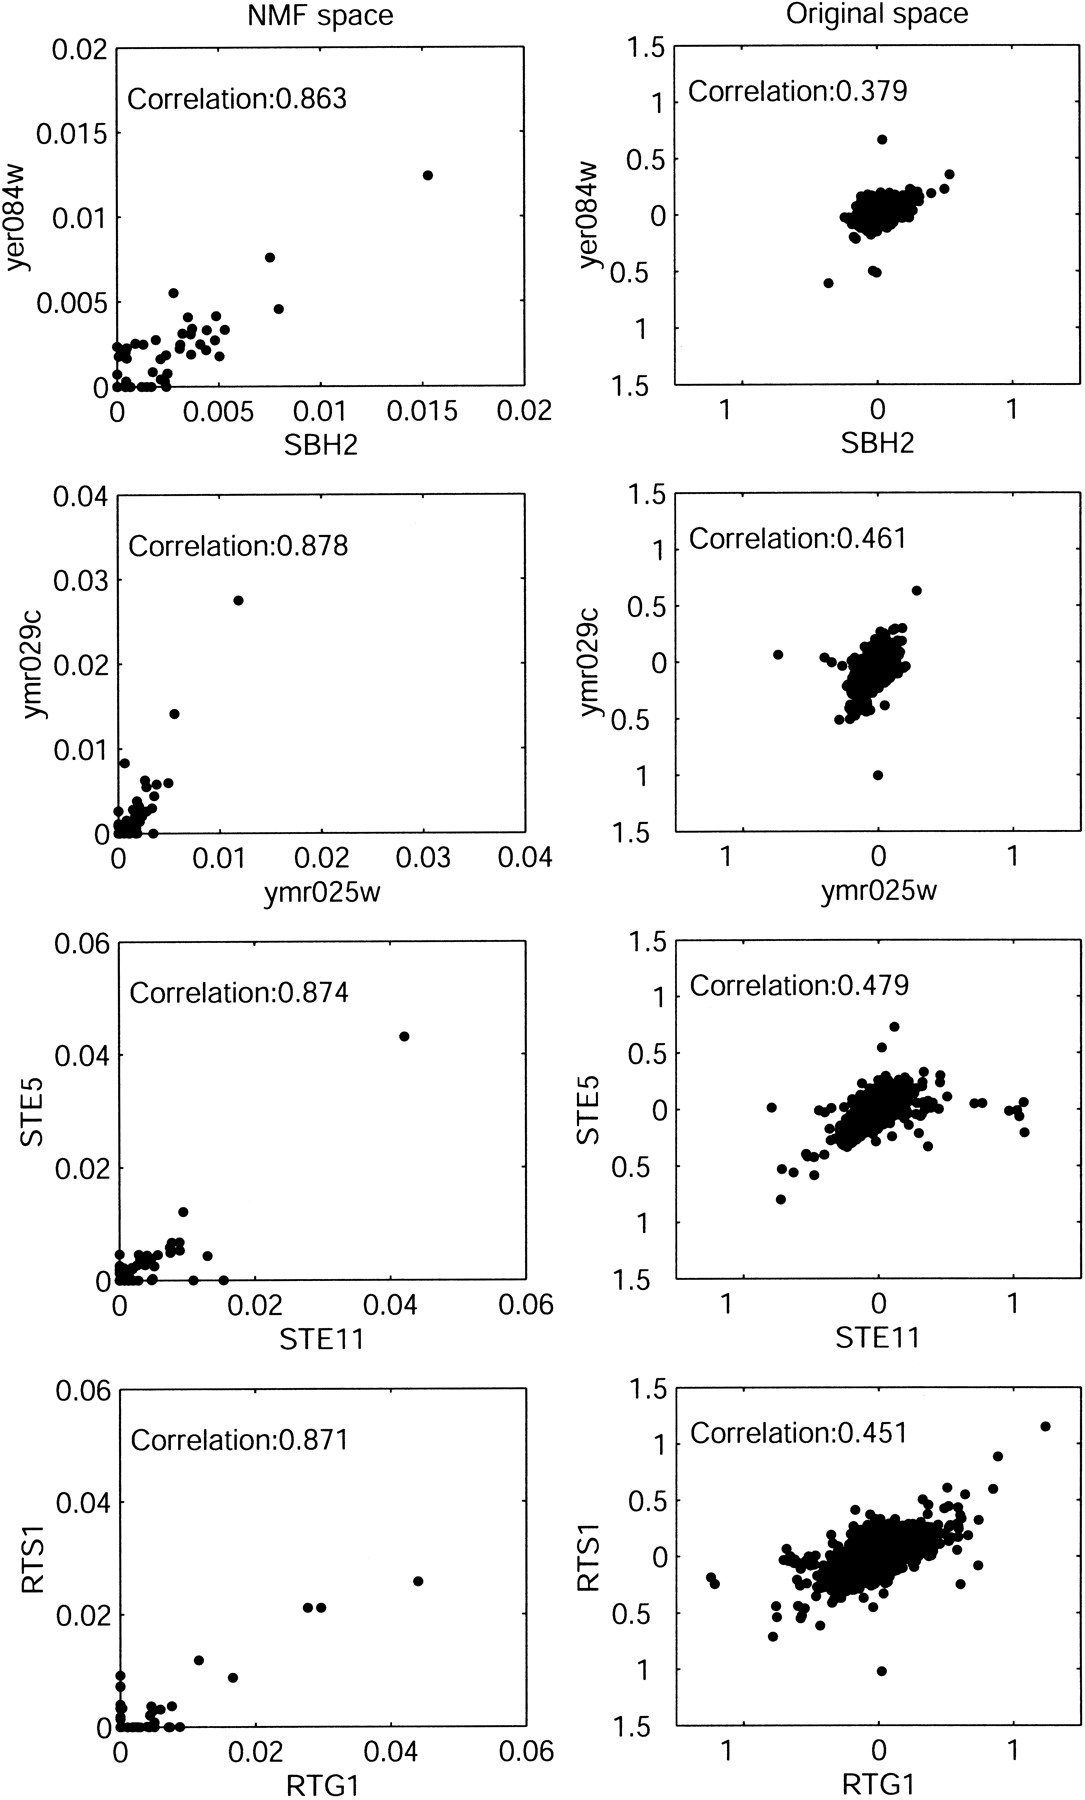
Correlation for four illustrative pairwise functional genetic relationships. For comparison, the correlation plot of the pair of experiments in NMF space is shown at left, and in the original gene space at right.
(Downloading may take up to 30 seconds. If the slide opens in your browser, select File -> Save As to save it.)
Click on image to view larger version.
Correlation for four illustrative pairwise functional genetic relationships. For comparison, the correlation plot of the pair of experiments in NMF space is shown at left, and in the original gene space at right.
 CiteULike
 Delicious
 Digg
Digg Facebook
 Google+
 Reddit
 Twitter
