
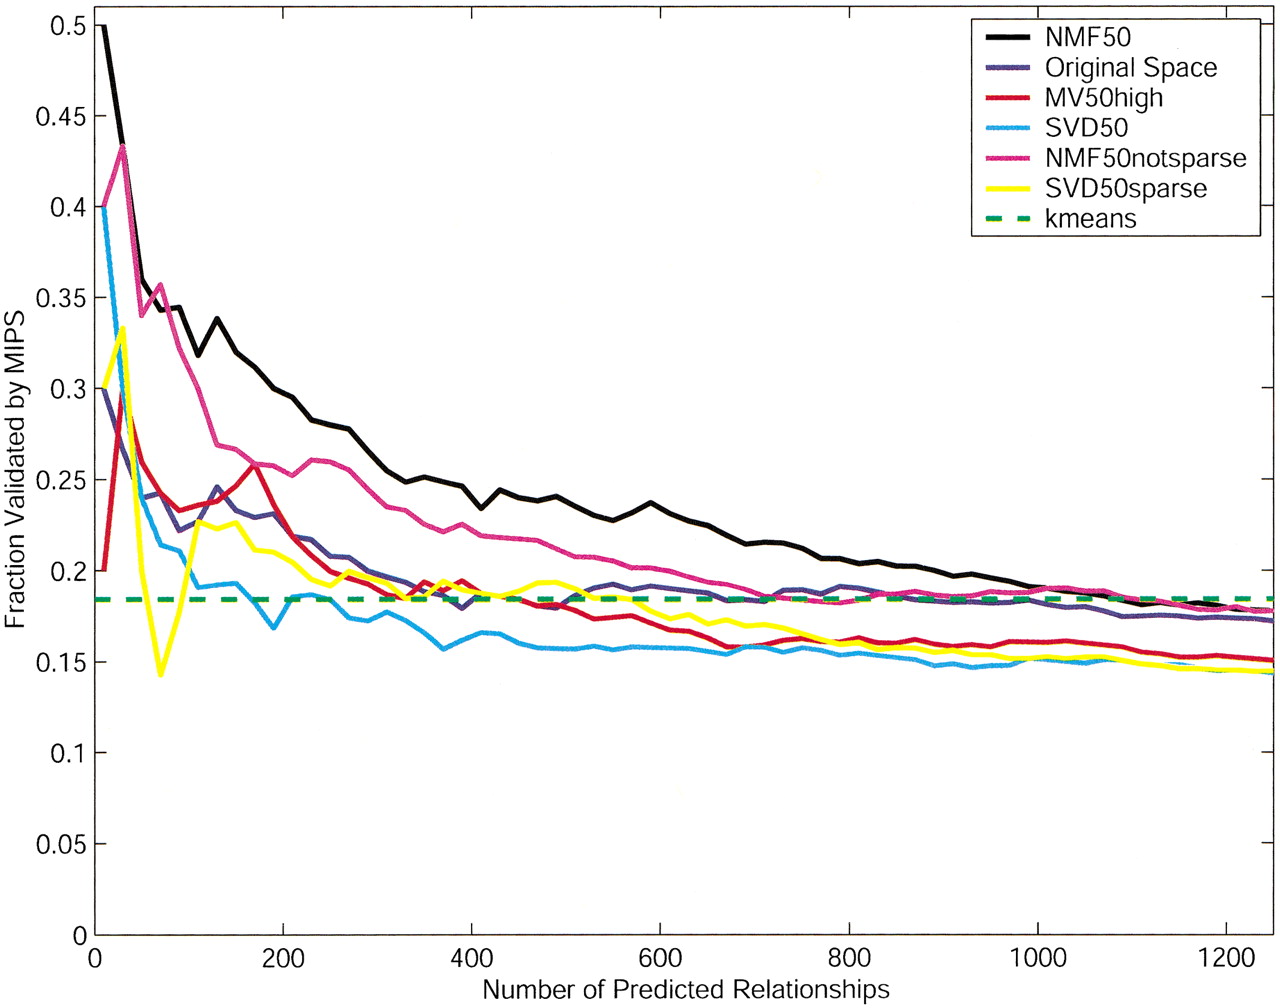
Figure 3
Performance of different spaces at predicting functional relationships between experiments with comparison to the MIPS classification of the deleted genes. (NMF50) NMF space with 50 basis vectors; (Original Space) original gene expression space; (SVD50) SVD space with 50 eigenvectors; (MV50high) space of the 50 most varying genes; (NMF50notsparse) NMF space with 50 basis vector without the sparsification procedure; (SVD50sparse) SVD sparsified; (k-means) predictions taken from k-means clustering with 50 clusters (3176 relationships).


