
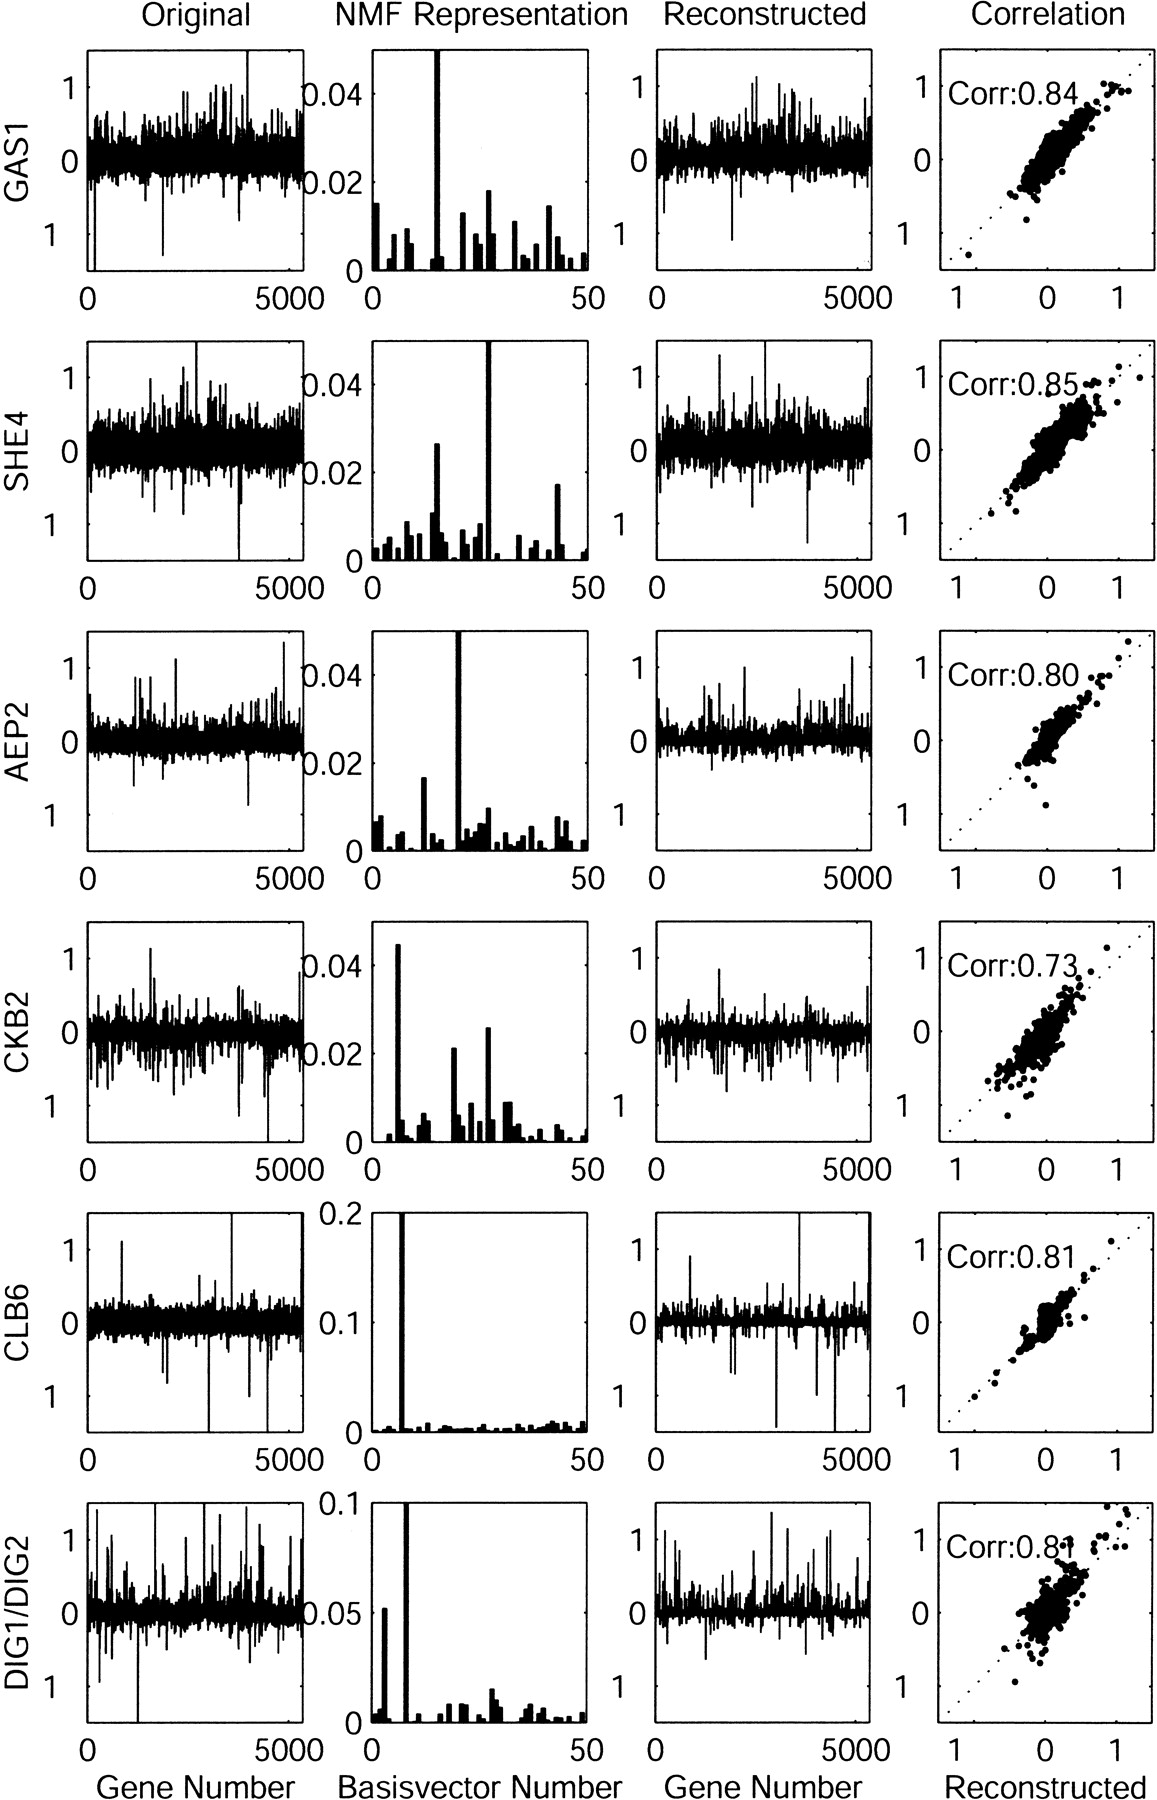
Representation of gene expression data in full and NMF-reduced spaces. (Left column) The original data (log-ratio) is shown for 6 individual experiments in the space of 5346 genes, in the second column from left, the 50-dimensional NMF representation is shown. In the third column from left, the reconstruction from the NMF representation back to the original space (using W · H) is shown. (Right column) The log-ratios of the original (y-axis) are plotted against the log-ratios of the reconstruction from the NMF representation back to the original experimental space (x-axis). The data show that the NMF reduction is capable of regenerating the experiments to relatively high fidelity, and that the NMF representation of an experiment is often dominated by one or a small number of features (basis vectors).


