
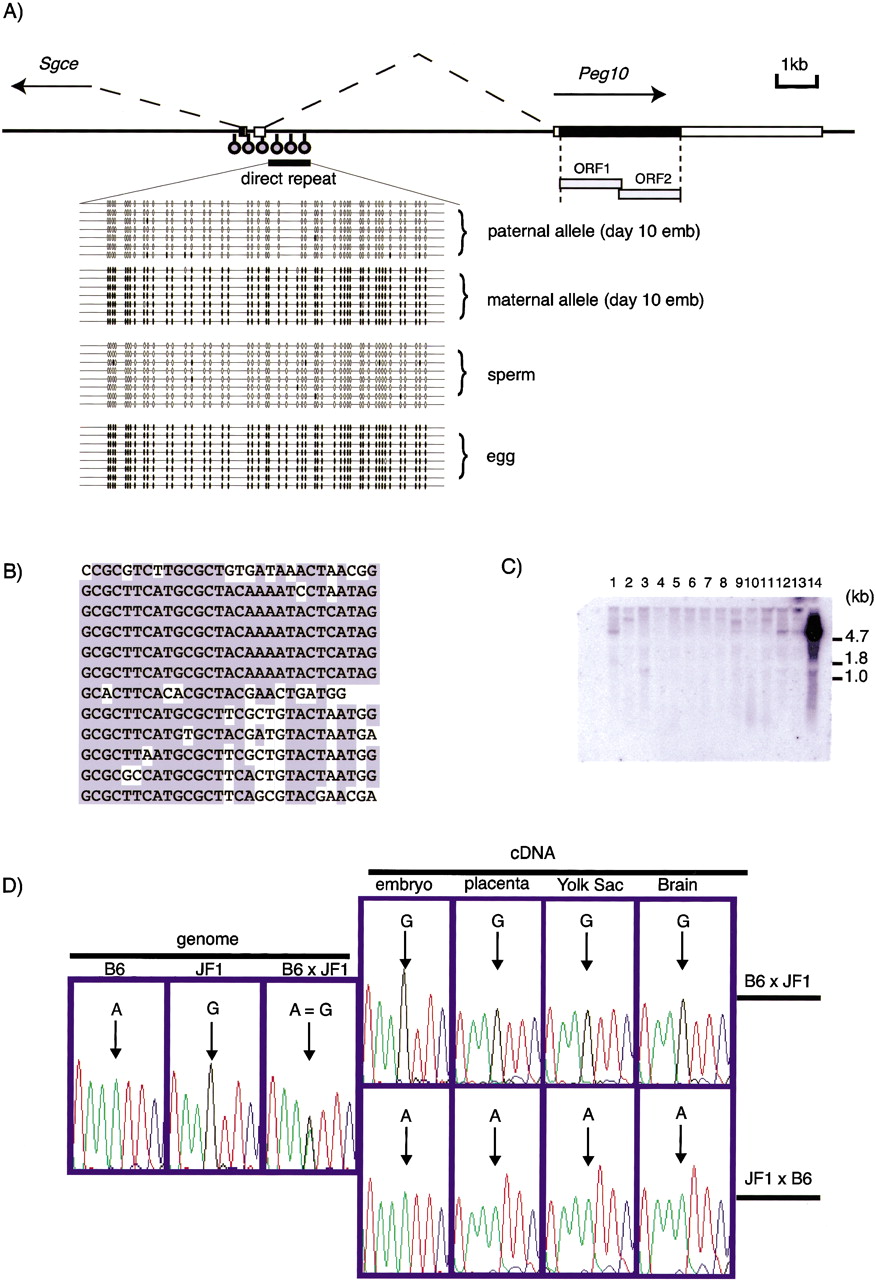
Peg10 imprinted expression associated with primary DMR. (A) The genomic structure of Peg10 and bisulfite sequencing analyses of the Peg10 repeated sequence region. The full-length Peg10 sequence was determined by 5′-RACE analysis. The white boxes are untranslated regions and putative open reading frames are shown with black boxes. Two putative ORFs of Peg10 are shown in gray boxes below; ORF1 shares 30% amino acid identity with the gag protein, and ORF2 predicted from a -1 frameshift of ORF1 shares 25% identity with the pol protein of Sushi-ichi retrotransposon, respectively. The translational frameshifting of ORF1–ORF2 is commonly observed in retroviruses and gypsy-type LTR retrotransposons. The arrows indicate the 5′–3′ direction of Peg10 and Sgce. The DNA methylation status of Peg10 repeats in day 10 embryo, eggs, and sperm are shown. Differential methylation was observed in the day 10 embryo as well as the day 10 placenta (data not shown). DNA polymorphisms between JF1 and B6 were used to distinguish parental alleles. The entire Peg10-Sgce CpG island indicated by gray lollipops shows a differentially methylated status similar to that in the Peg10 repeats (data not shown). (B) Twelve Peg10 intronic 29-bp repeat sequences. Shaded boxes indicate homology with the most frequent sequence, GCGCTTCATGCGCTACAAAATACTCATAG (four times). (C) Northern blot profiles of Peg 10 in mouse adult tissues. Total RNA from mouse adult brain (lane 1), heart (lane 2), lung (lane 3), liver (lane 4), spleen (lane 5), kidney (lane 6), stomach (lane 7), small intestine (lane 8), skeletal muscle (lane 9), skin (lane 10), thymus (lane 11), testis (lane 12), uterus (lane 13), and placenta (lane 14) was analyzed. Ribosomal RNA detected by ethidium bromide (EtBr) staining was used as a marker. Strong Peg10 expression was observed only in placenta, and the major transcript was estimated to be -6.5 kb long. (D) Paternal expression of Peg10. Paternal expression of Peg10 in day 10 embryo, placenta, yolk sac, and neonatal brain is demonstrated by direct sequencing of the RT-PCR products, by comparing the sequence profiles of genomic DNA containing B6 and JF1 alleles equally.


