
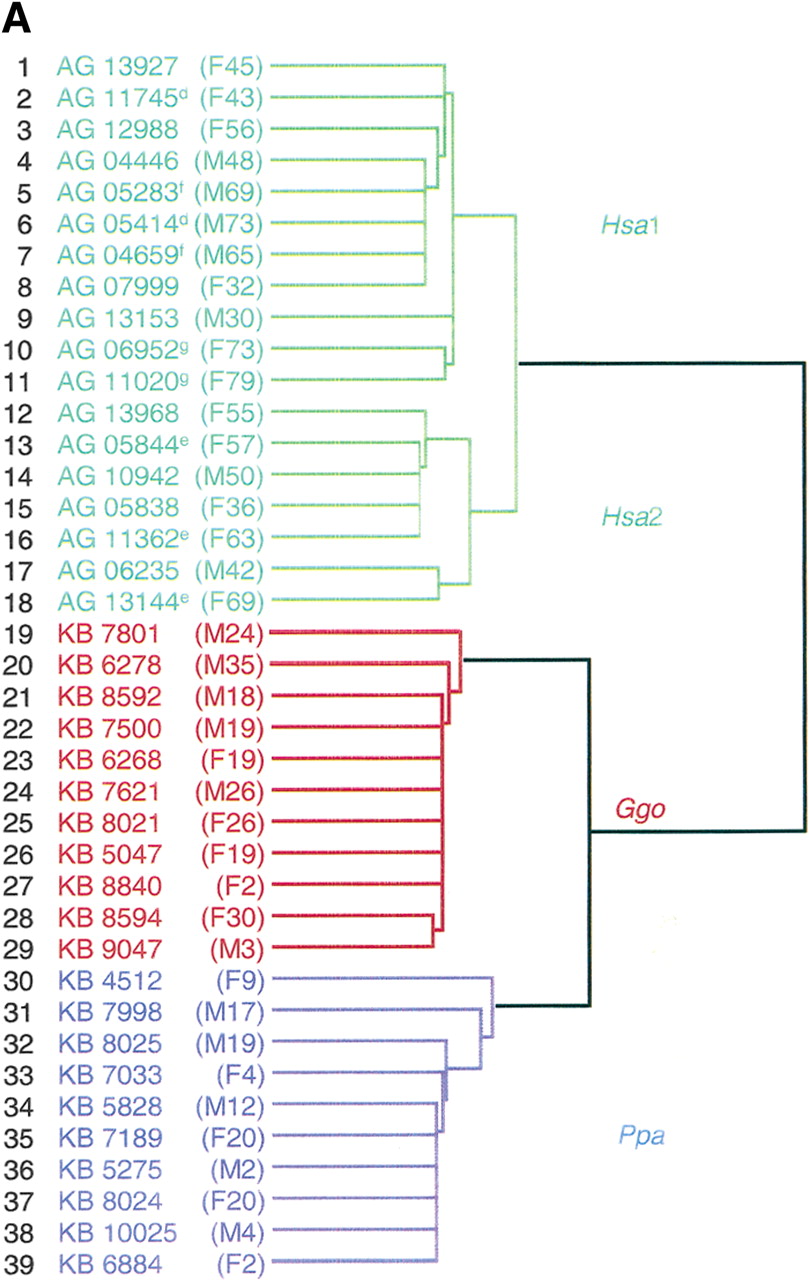
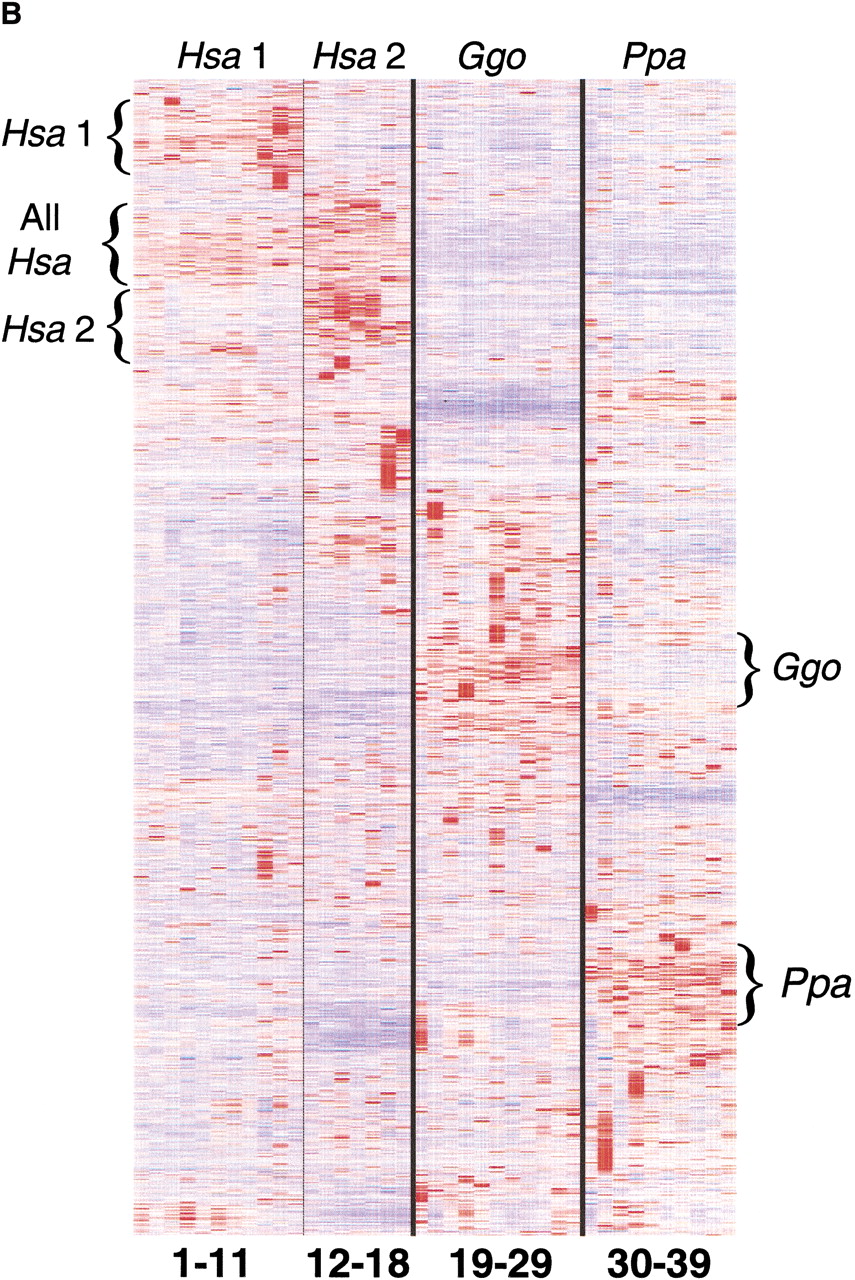
Hierarchical clustering analysis of human and African great ape fibroblast cell line expression patterns. (A) Dendrogram generated from the average linkage hierarchical clustering of geneexpression patterns from all 39 fibroblast cell lines. The cluster tree is based on expression levels of >5300 genes, whose coefficient of variation is >0.3 across all cell lines. The age and gender of the fibroblast donor is given in parenthesis. Human (Hsa), bonobo (Ppa), and gorilla (Ggo) cell lines are depicted by green, blue, and red lines, respectively. Samples with the same superscript are from the same donor at different ages. Human samples fall into Hsa1 and Hsa2 sub-branches. (B) Gene clusters derived from the analysis of all cell lines. Each horizontal strip represents the expression patterns of one gene. Relative high and low expressers within a single gene are depicted in red and blue, respectively. Human, gorilla, and bonobo samples are listed at the top of the column, whereas the numerical identity of each cell line (Fig. 4A) is listed at bottom. Gene clusters are noted on the side of the diagram by the name of the species with the highest expression levels.


