
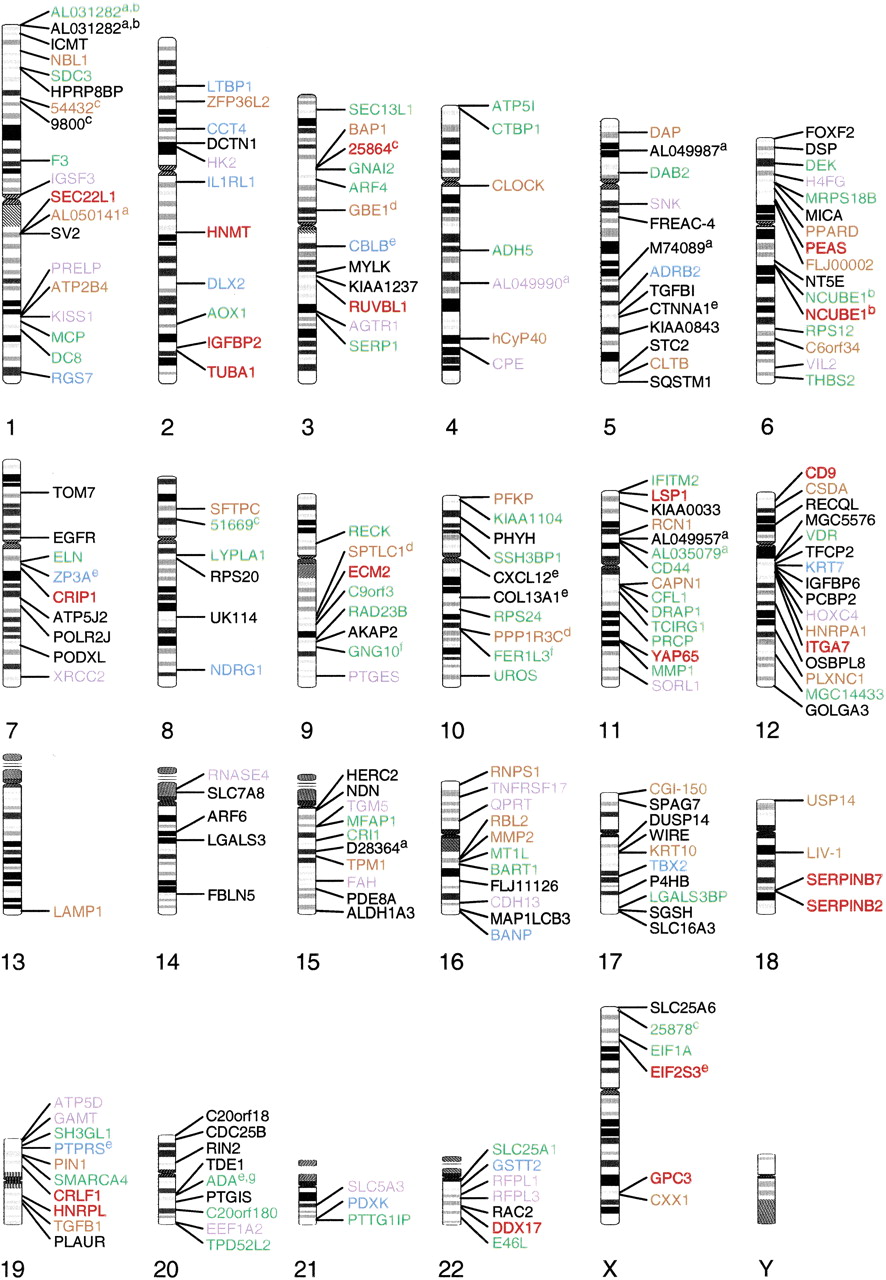
Chromosomal locations of differentially expressed genes among humans and the African great apes. The locations of such genes (up-regulated greater than twofold [lower bound of 95% CI] in at least one species relative to the others) are indicated on the human karyotype on the basis of the human genome reference sequence. Gene names are given in gold (up in Hsa and Ggo), black (up in Hsa), green (up in Hsa and Ppa), purple (up in Ggo), red (up in Ppa and Ggo), and blue (up in Ppa). (a) GenBank Accession Number; (b) two different probe tilings interrogating the same gene give different outcomes; (c) LocusLink ID; (d) Hsa greater than twofold up-regulated relative to Ggo; (e) two different probe tilings interrogating the same gene give the same outcome; (f) Hsa greater than twofold up-regulated relative to Ppa; (g) Ppa greater than twofold up-regulated relative to Hsa.


