
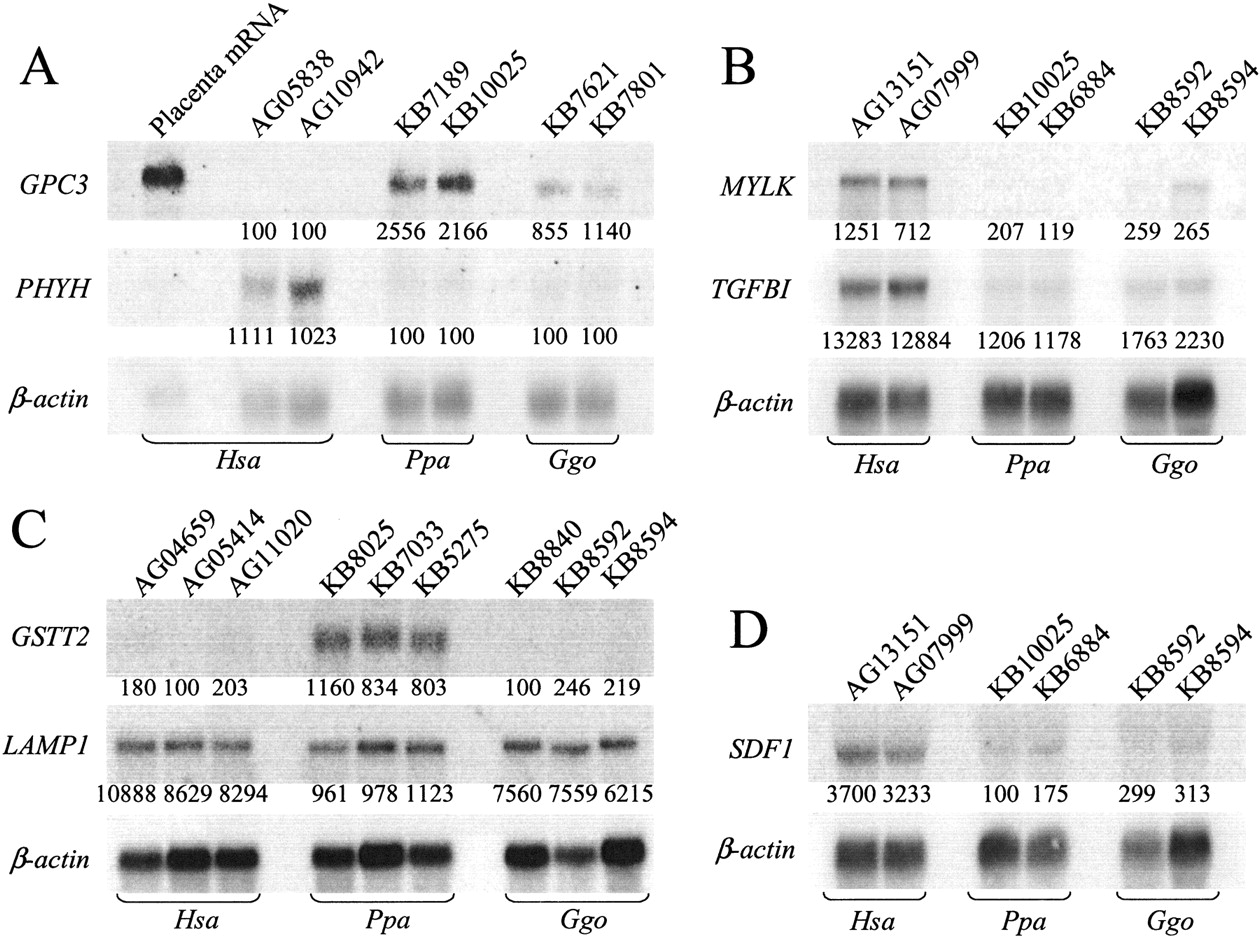
Figure 2
Confirmatory Northern blot analysis of microarray results. (A–D) Fibroblast cell line names are given at the top of each lane. At the bottom of each lane is the expression level score assigned by microarray analysis. To the left of each strip is the identity of the gene interrogated. In each panel, the relative abundance of β-actin for each blot is given to normalize for loading abundance. Signal gain and contrast in each strip is adjusted for clarity.


