
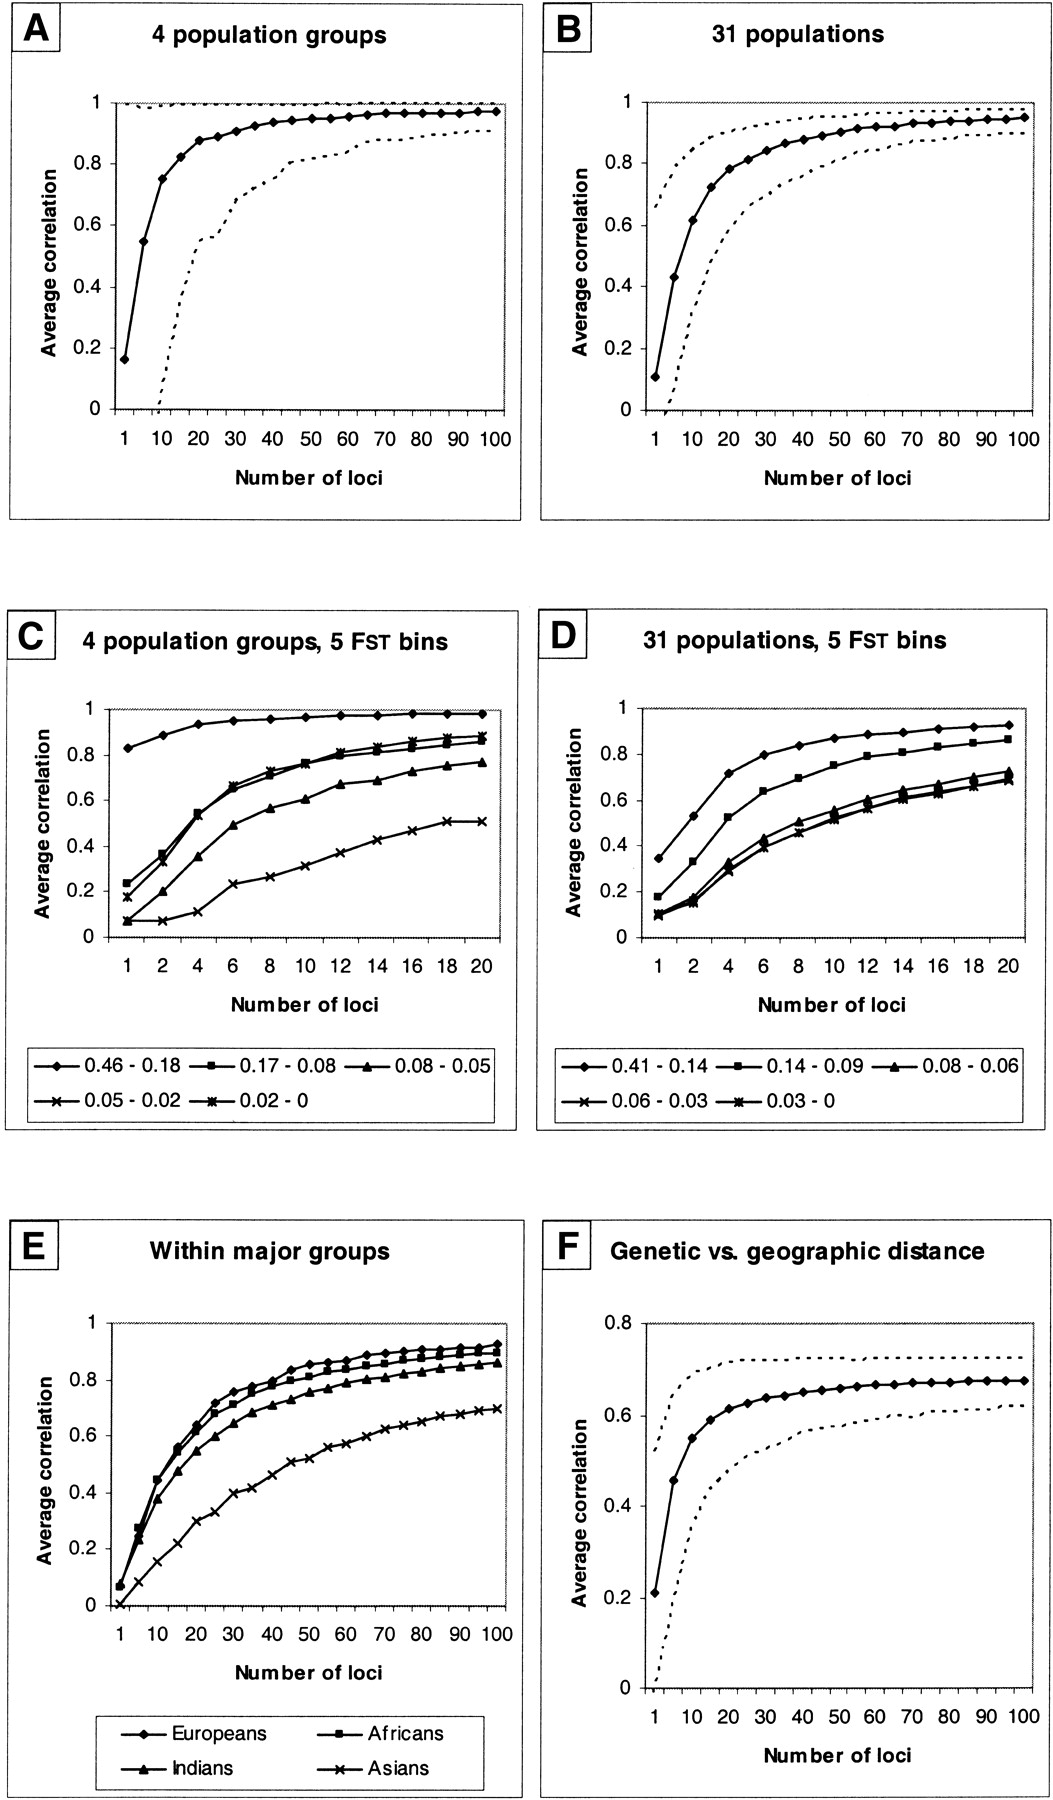
Average correlations between genetic distance matrices for increasing numbers of resampled Alu loci. (A) Four major geographic groups of Africa, Asia, Europe, and India; (B) 31 populations; (C) the 4 major groups with Alu loci sorted into 5 FST bins (actual FST values are indicated); (D) 31 populations and 5 FST bins; (E) correlations for populations within each of the 4 major geographic groups; (F) the correlation between genetics distance matrices and geographic distance for 31 populations. All points represent mean values from 1000 product-moment correlations. Broken lines indicate the 95% confidence interval.


