
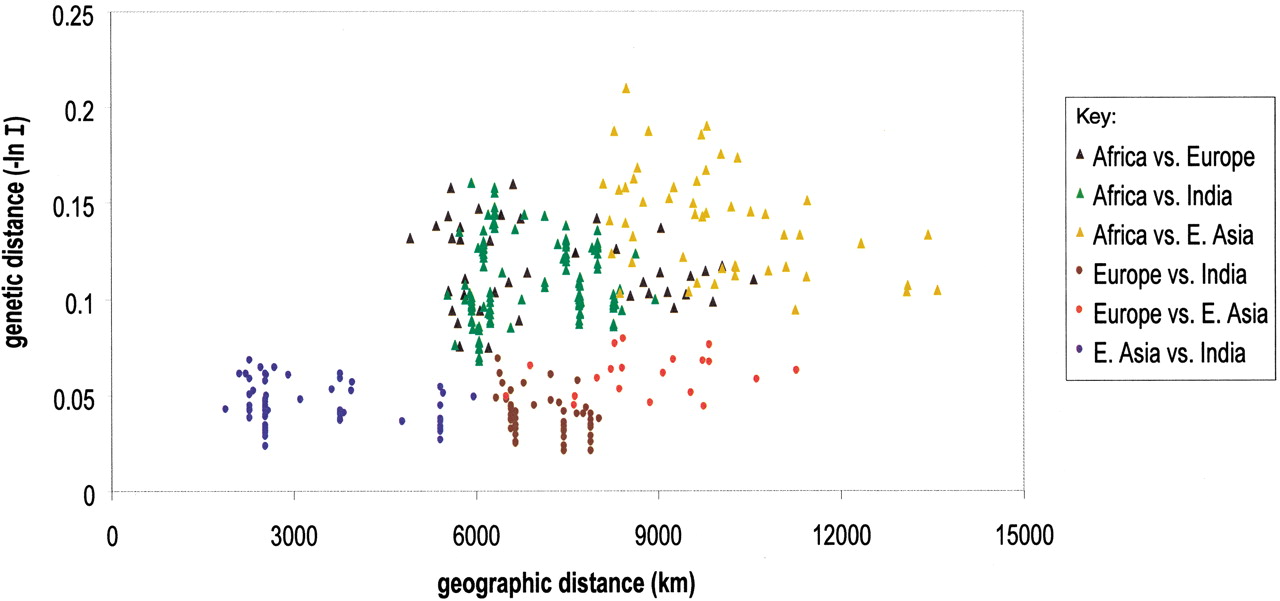
Figure 7
Geographic distance is plotted against genetic distance measured as the negative log of Nei's identity for pairwise comparisons between population groups from Africa, E. Asia, Europe, and India. The six possible comparison groups are color coded. Comparisons using Africans are triangles and Eurasians are circles.


