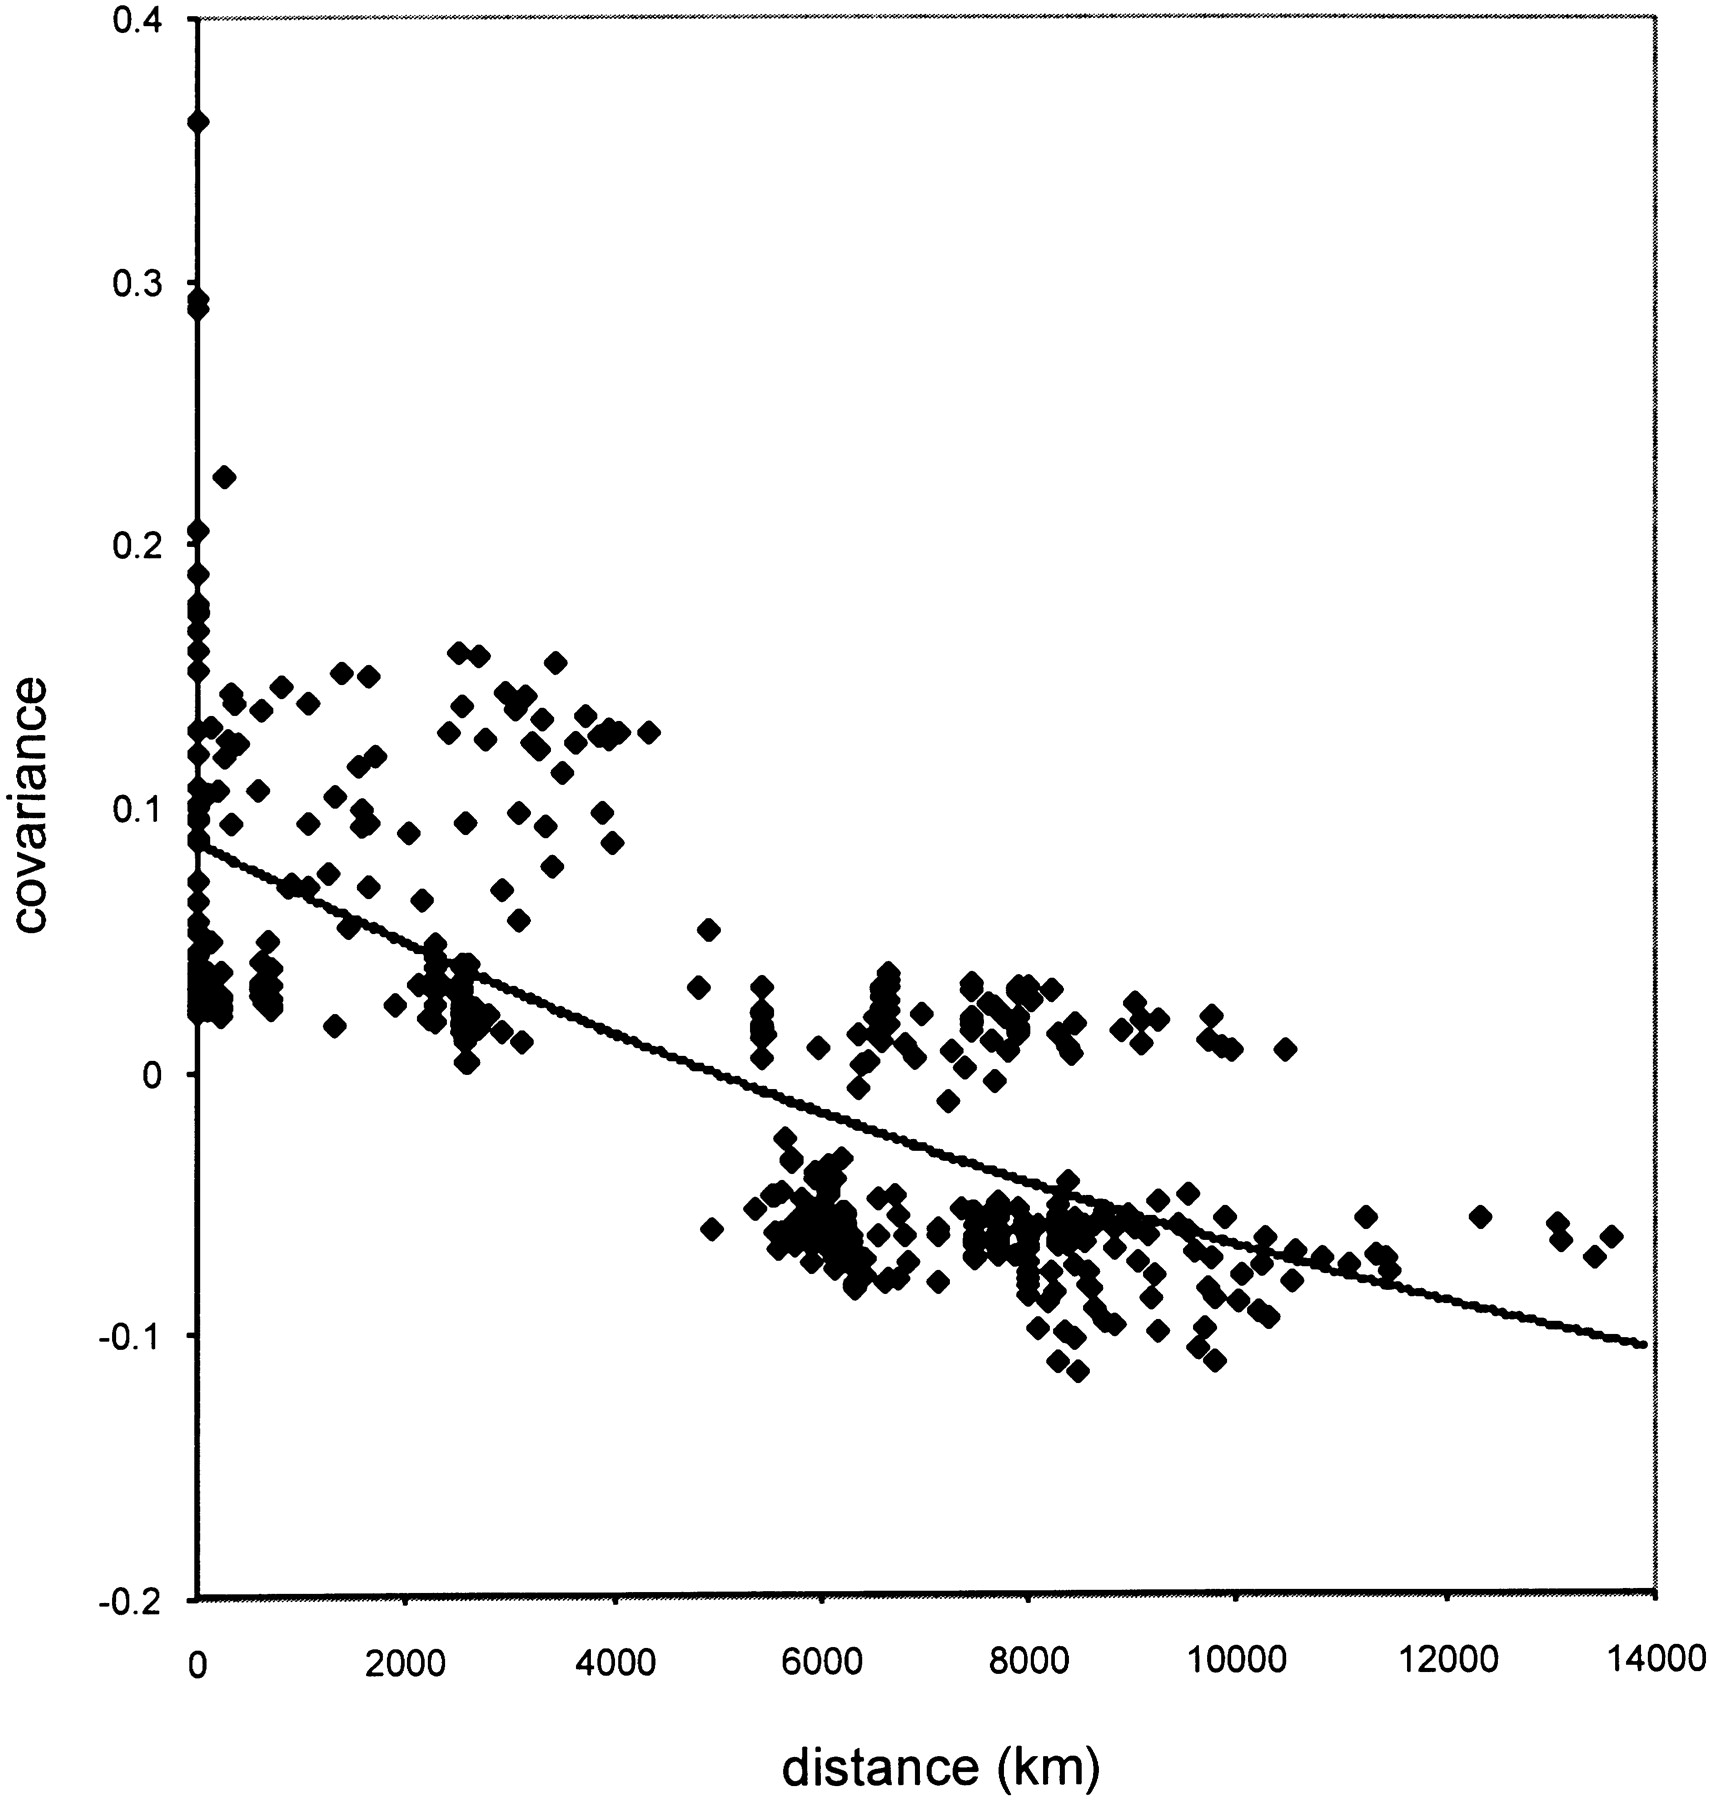
Genetic Variation Among World Populations: Inferences From 100 Alu Insertion Polymorphisms

(Downloading may take up to 30 seconds. If the slide opens in your browser, select File -> Save As to save it.)

Click on image to view larger version.

Figure 6
Figure 6

Relationship between geographic and genetic distance. Great circle distances (in kilometers) are plotted against the covariance of allele frequencies for 31 populations. A nonlinear regression line based on a one-dimensional Malécot model is fit to the data.

This Article

  1. Genome Res. 13: 1607-1618

Preprint Server