
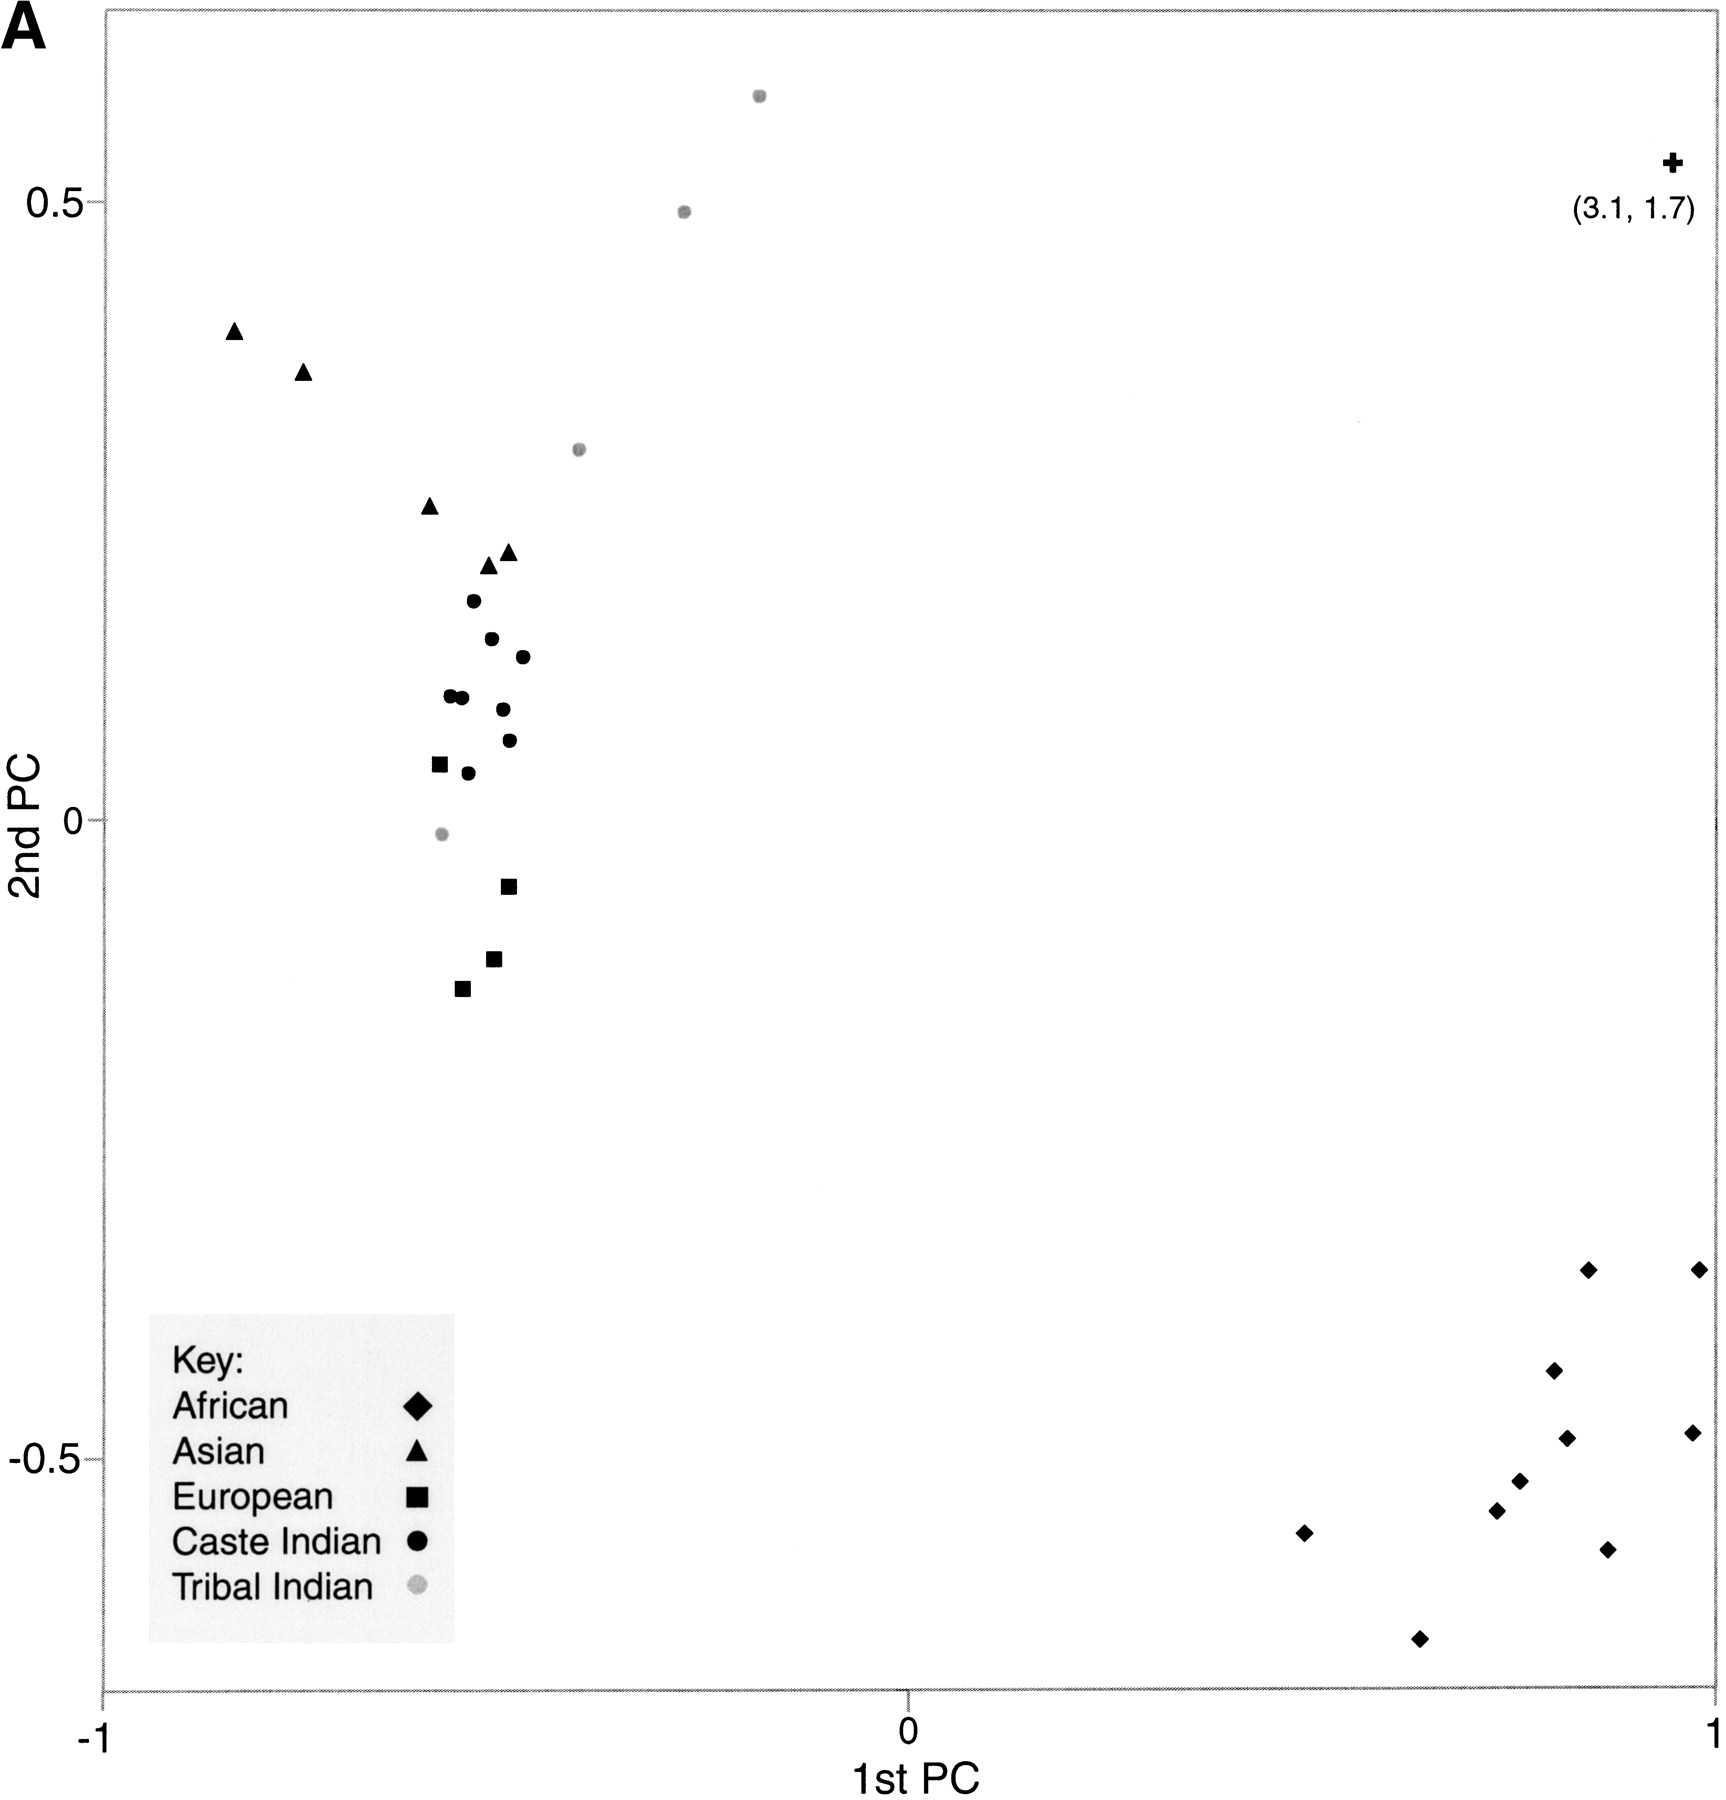
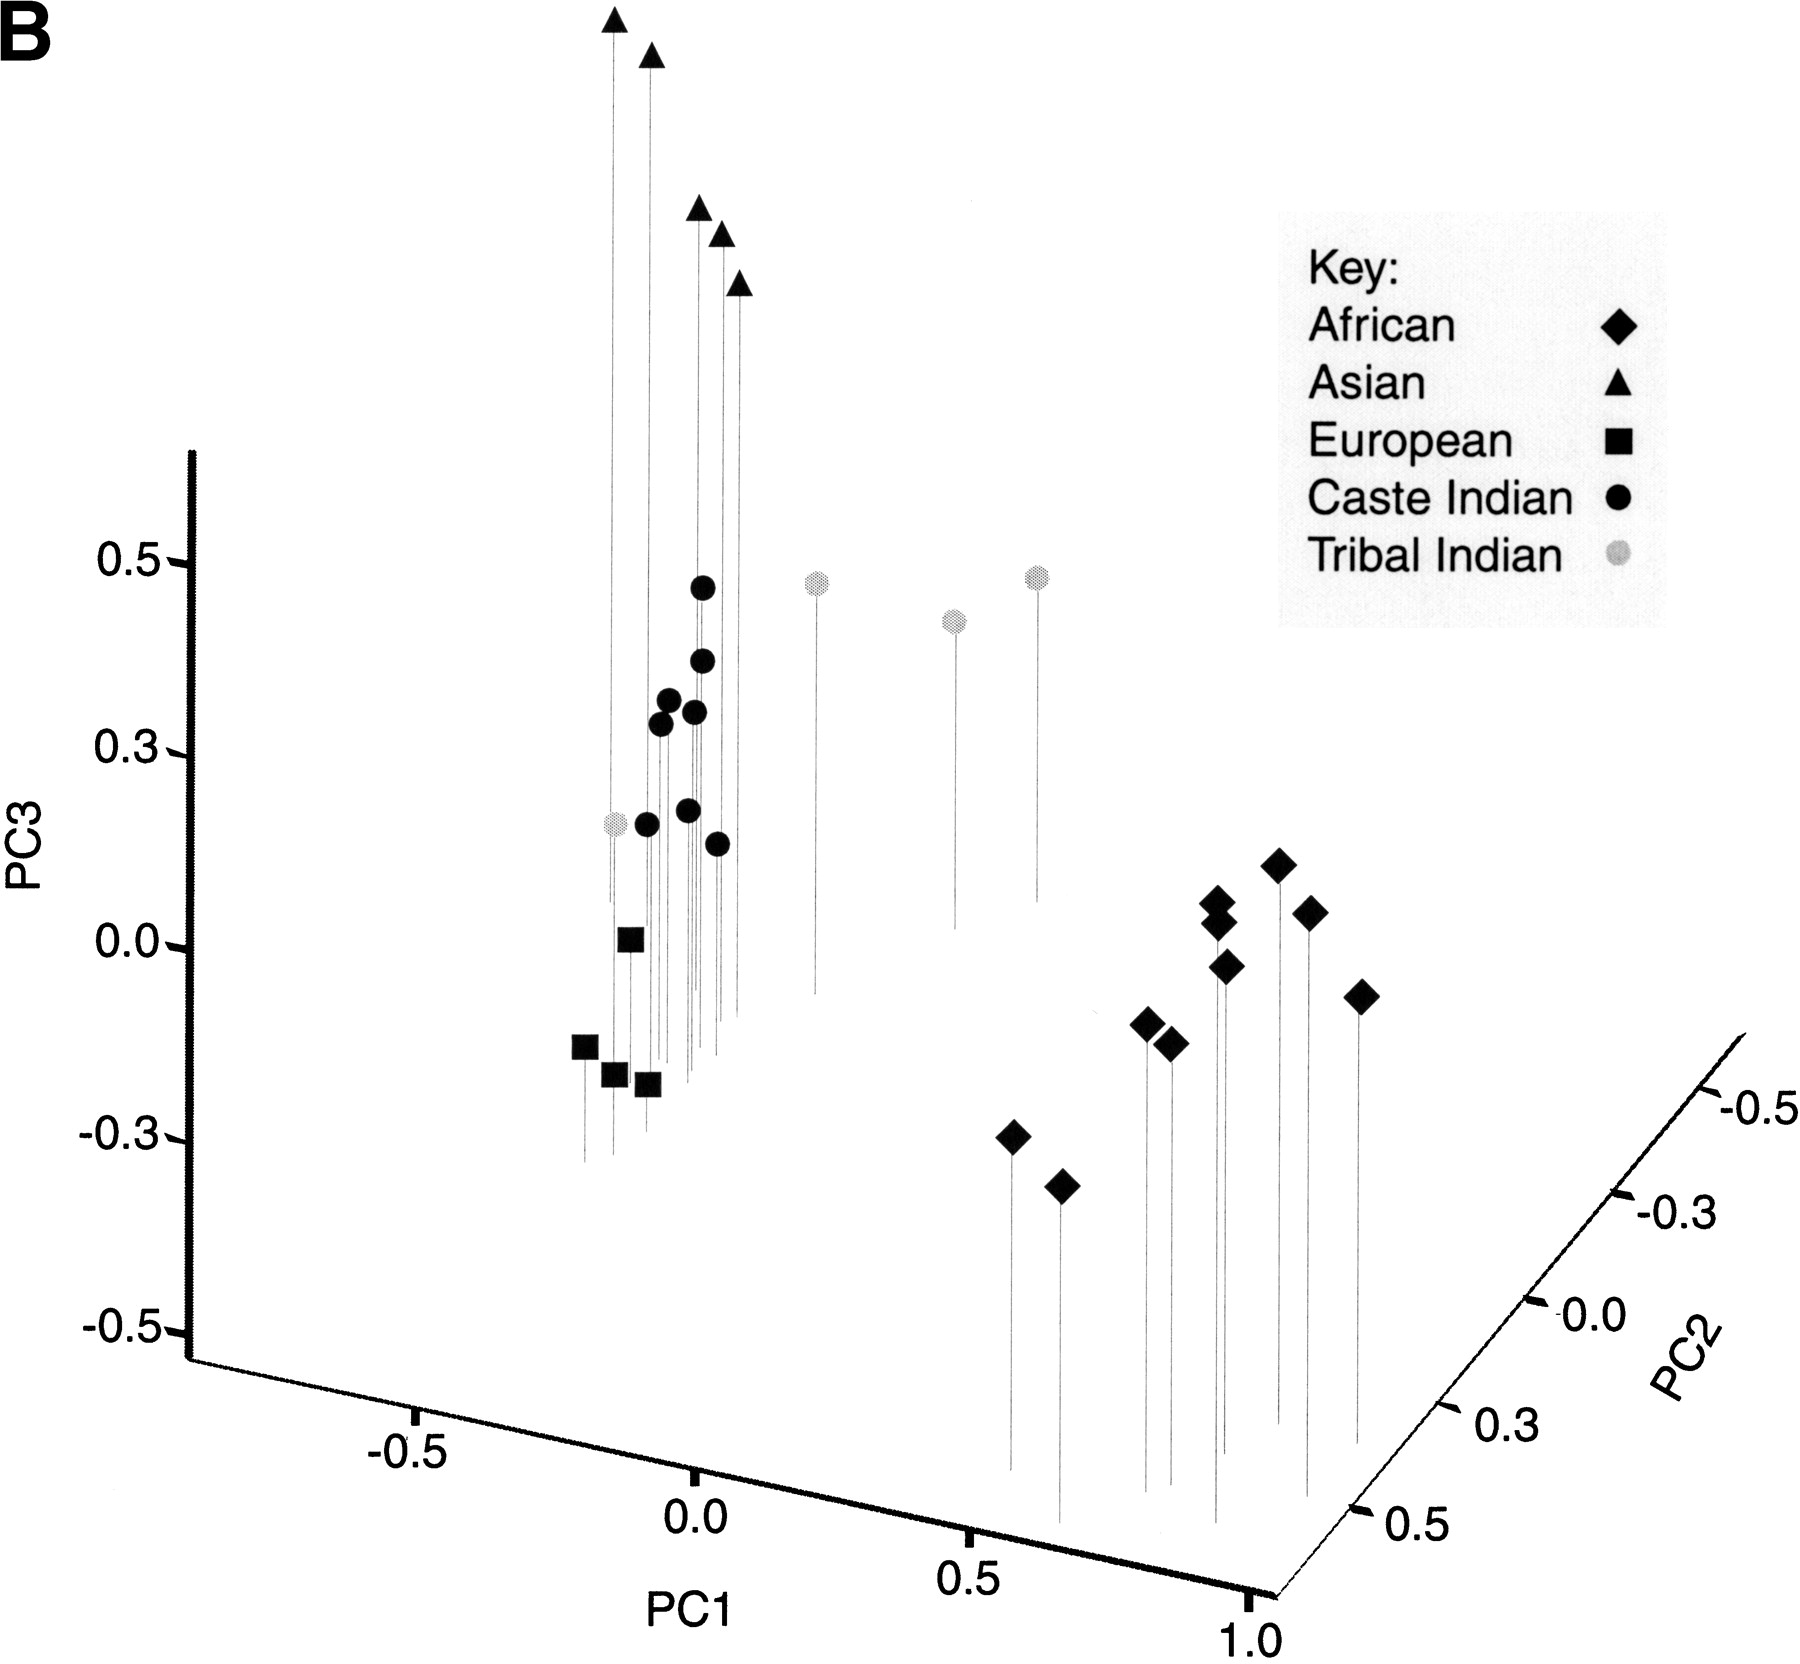
Figure 4
(A) A plot of the first two principal components of a genetic distance matrix estimated for 31 populations. The hypothetical ancestral, or root population is also shown on the graph, although the actual coordinates of this population on the first two principal components (shown in parentheses below the symbol) place it well off the graph. (B) A plot of the first three principal components of the genetic distance matrix. The length of each line below the symbol represents the coordinate of each population on the third component.


