
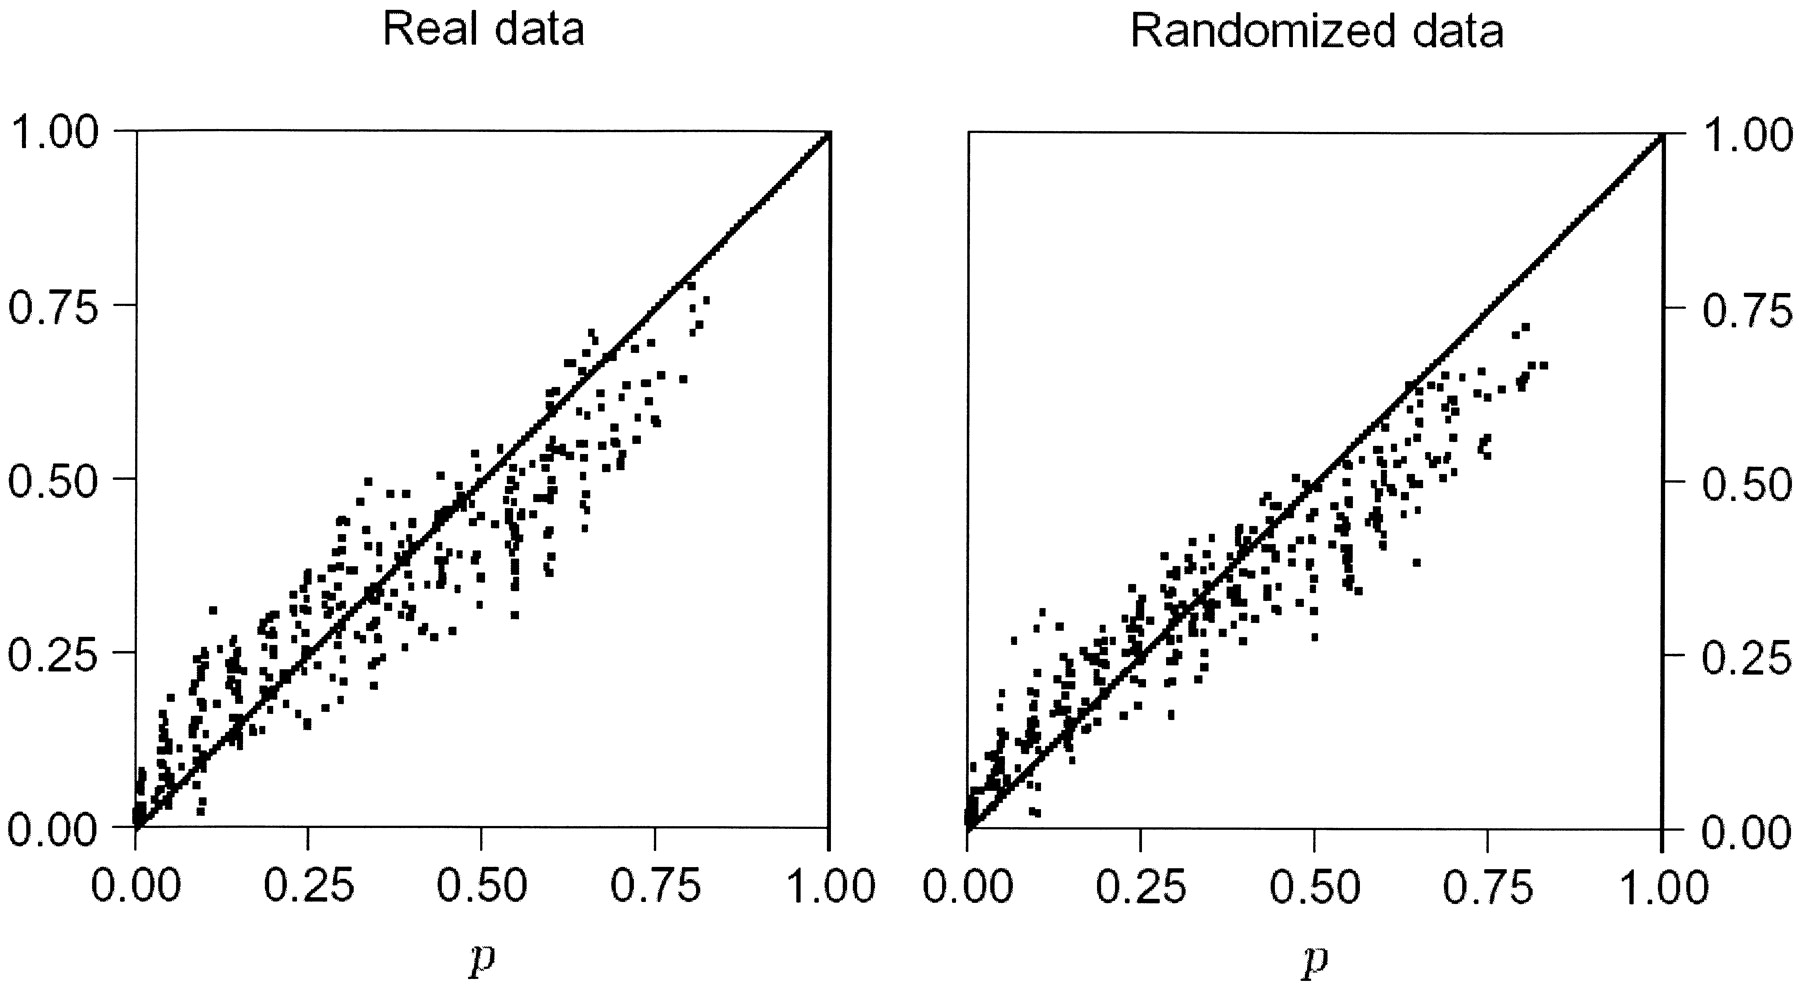
Figure 2
The cumulative distribution of P-values measuring significance of deviation from Hardy-Weinberg expectation. The cumulative frequency of P-values is plotted against each value of P for 100 Alu loci and 31 populations (left) and for 100 loci with the same allele frequencies but randomly assigned genotypes (right).


