
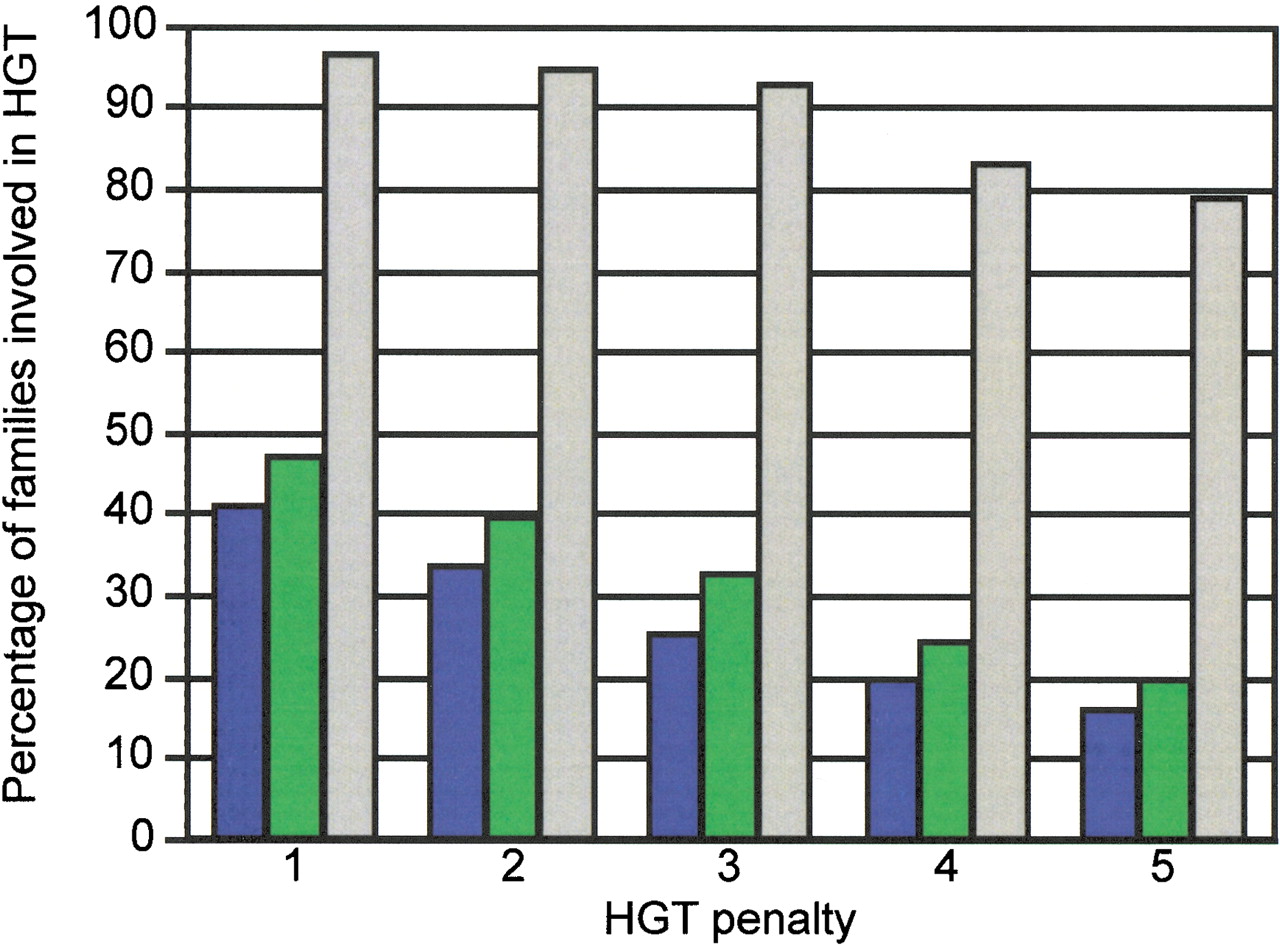
Figure 3
The fraction of families predicted to be involved in horizontal gene transfer at different HGT penalties. Percentages for the 16S rRNA tree are represented by blue bars, for the gene content tree by green bars, and for the shuffled tree by grey bars.


