
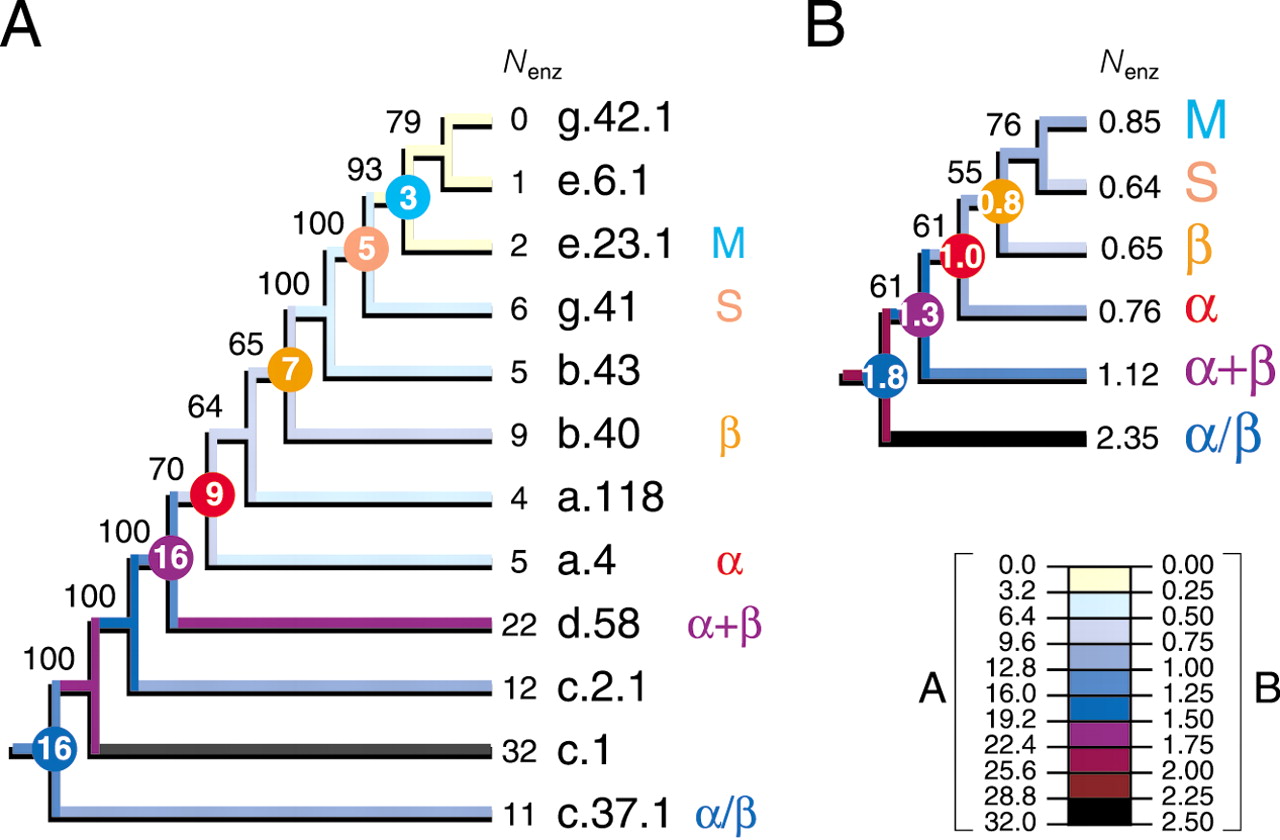
Tracing the evolutionary association of enzymatic function and protein architecture. Cladograms show the phylogenetic relationship of primitive folds (A) and protein classes (B) and were derived from a single tree of 907 steps (CI = 0.690, RI = 0.809; g1 = -0.911; PTP, P = 0.001) and 5209 steps (CI = 0.683, RI = 0.598; g1 = -0.792; PTP, P = 0.001) retained after branch-and-bound and exhaustive searches, respectively. The tree of protein classes was derived from fold occurrence data averaged across populated domains for each distribution pattern (Fig. 1) and for each of the six protein classes. The number of enzymatic functions (Nenz) was similarly averaged. Square-change parsimony was used to reconstruct ancestral Nenz states as continuous characters in the trees using McCLADE with the rooted option. These values are shown encircled for selected internal nodes.


