
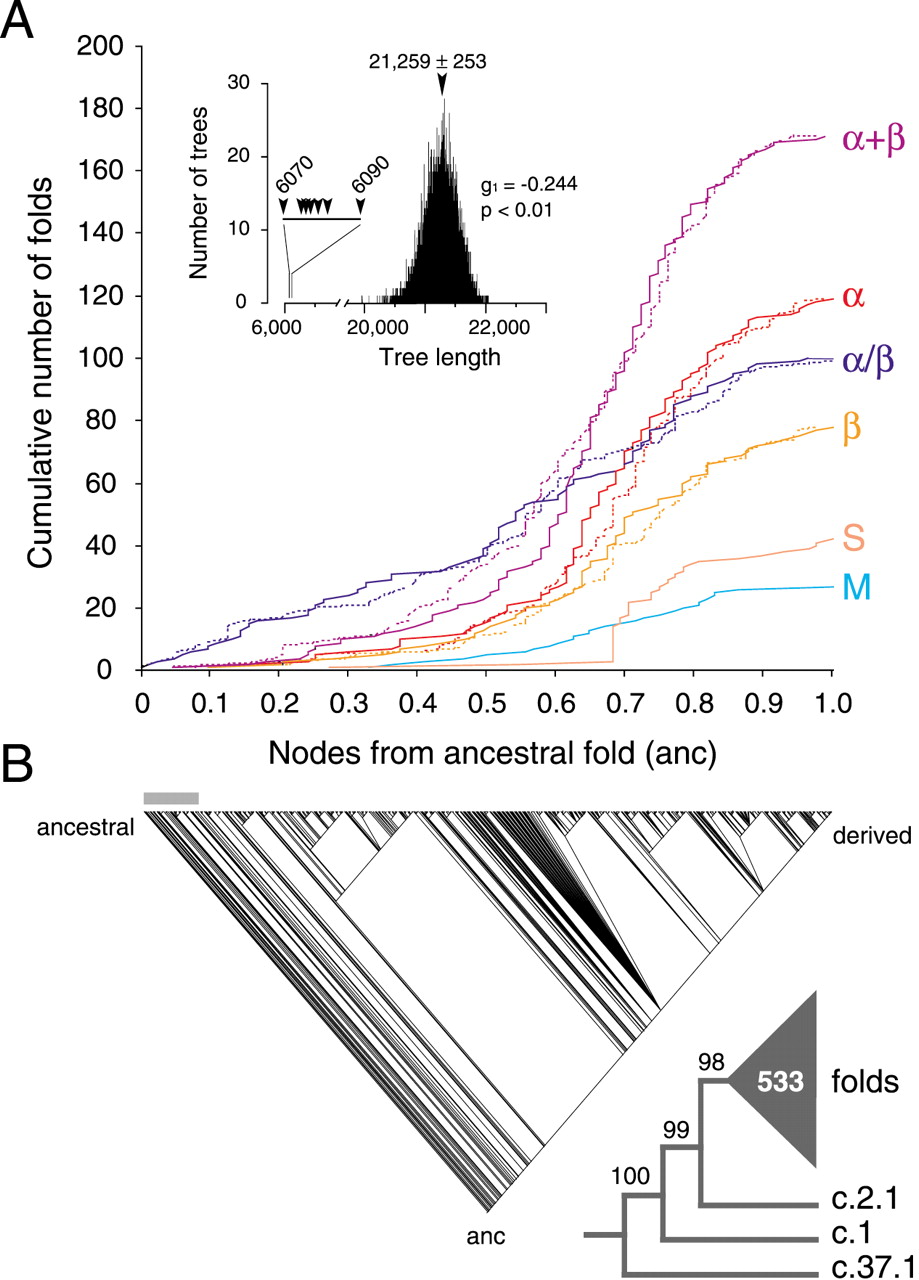
Phylogenetic reconstruction of a universal tree of protein architecture. (A) Cumulative frequency plots illustrate the accumulation of folds in the six major classes of protein architecture along optimal (continuous lines) and suboptimal phylogenetic trees (dashed lines). Cumulative fold number is given as a function of distance in nodes from the hypothetical ancestral fold (anc) in a relative scale. Suboptimal tree reconstructions (spanning 6070 and 6090 steps) show that systematic and random error did not substantially affect the rates of fold accumulation. The inset shows tree distribution profiles and metrics of skewness. (B) One optimal most-parsimonious tree (6070 steps; CI = 0.105, RI = 0.773; PTP test, P = 0.001) was recovered from a heuristic search with TBR branch swapping and 10 replicates of random addition sequence. To decrease search times during branch swapping of suboptimal trees, only 10 trees of length ≥D + 1 were kept in each replicate, with D being the minimum tree length found in multiple iterative searches. The bar defines when protein classes occurred for the first time. The reduced cladogram shows branches with BS supports <98% collapsed into a multifurcation (triangle with number of multifurcating branches).


