
Figure 1
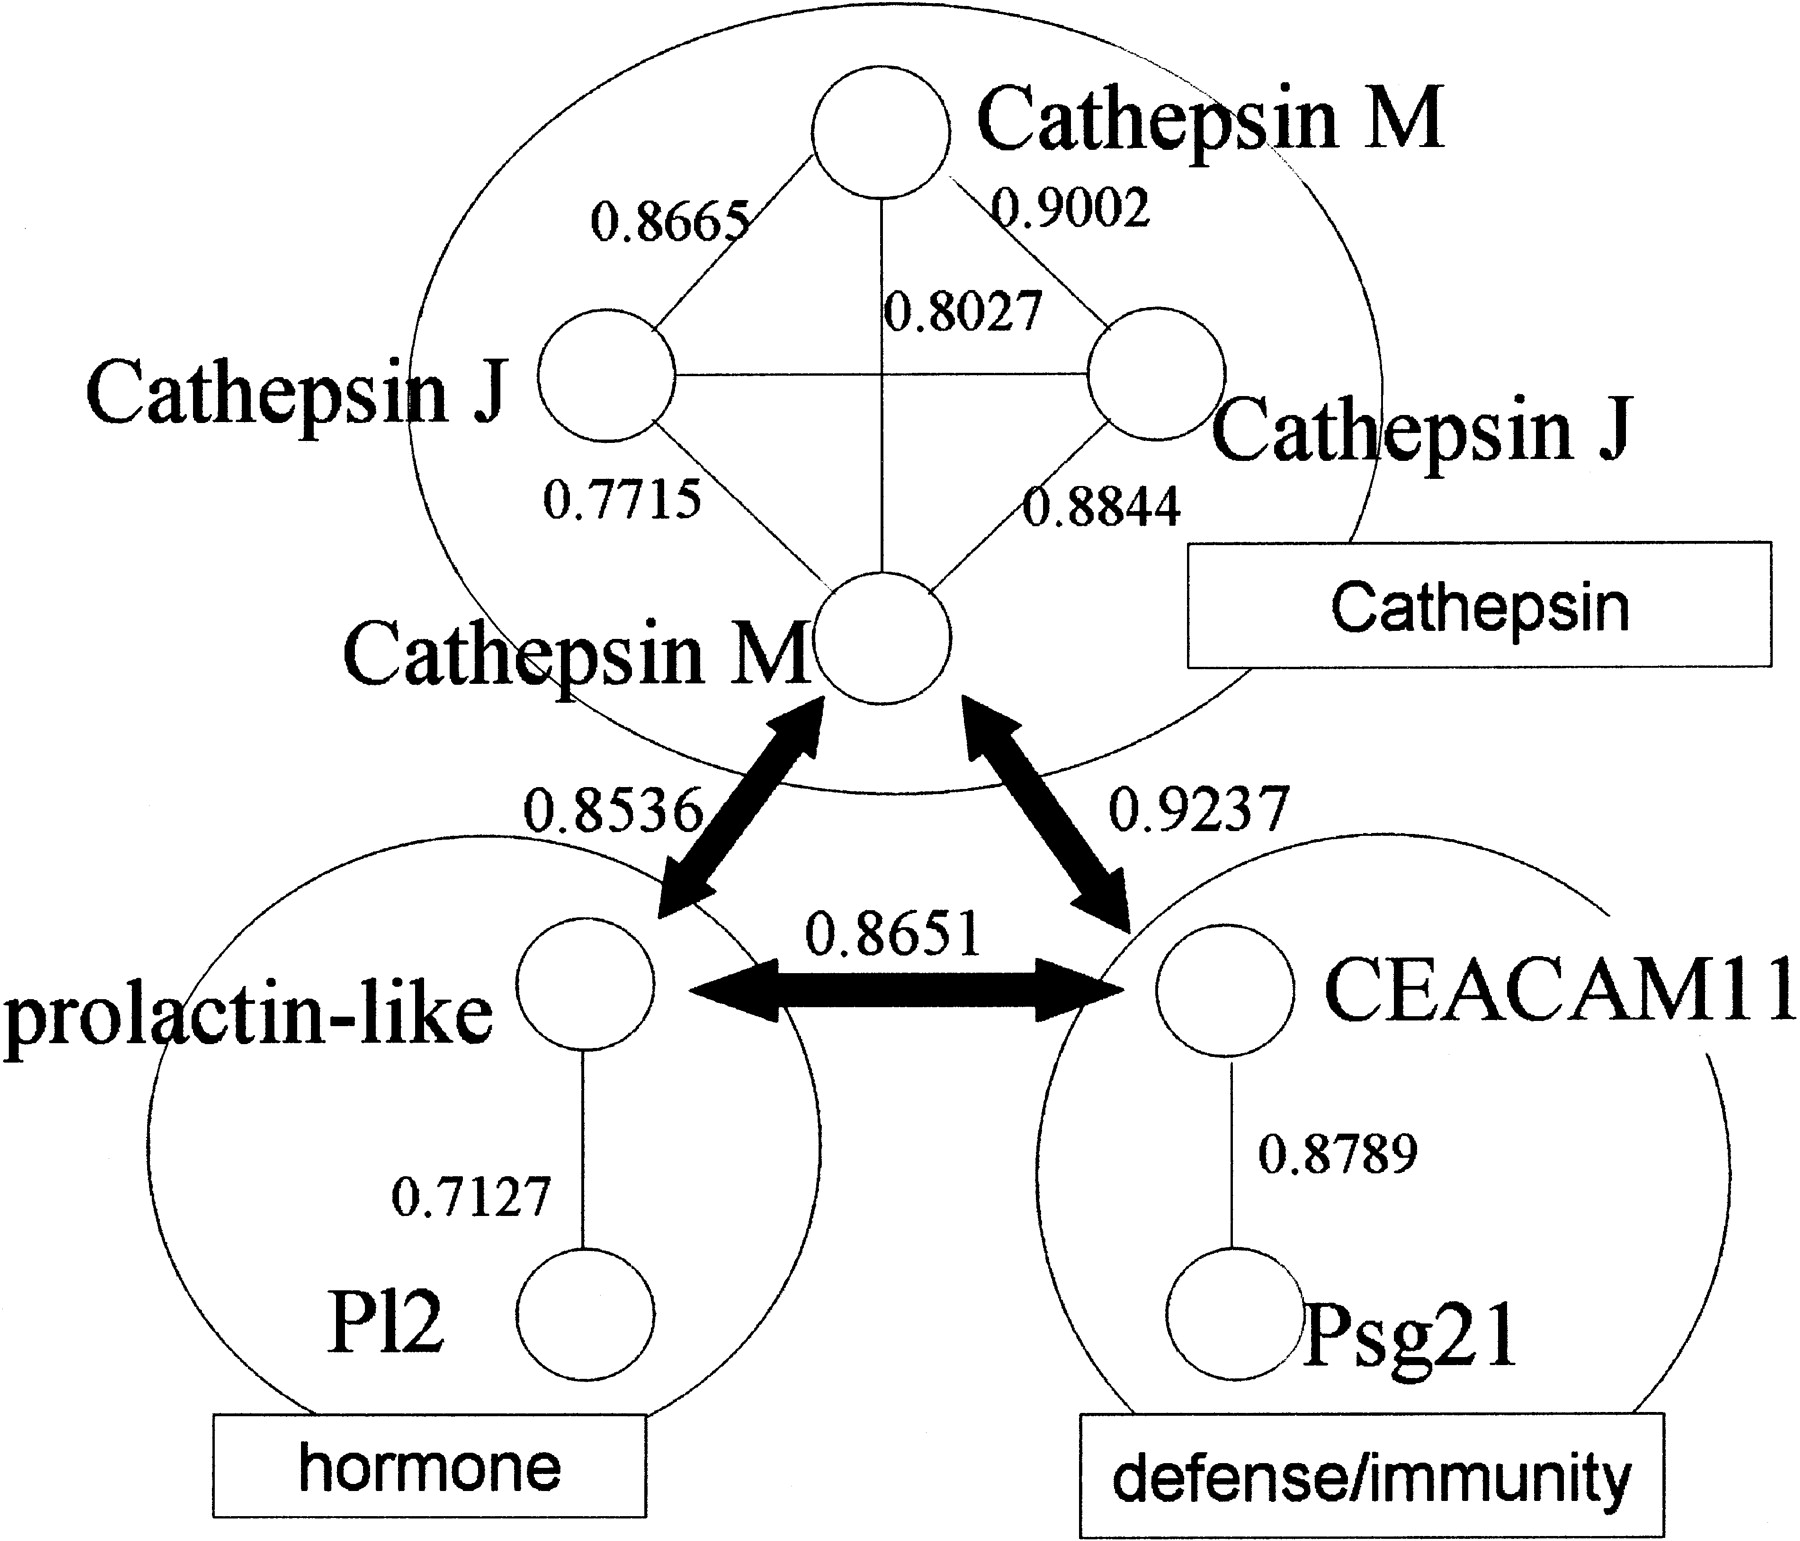
An obtained cluster with seven clones. Each small circle represents a clone, and edges represent the correlation coefficients between clones. The seven clones are categorized into three groups.
(Downloading may take up to 30 seconds. If the slide opens in your browser, select File -> Save As to save it.)
Click on image to view larger version.
An obtained cluster with seven clones. Each small circle represents a clone, and edges represent the correlation coefficients between clones. The seven clones are categorized into three groups.
 CiteULike
 Delicious
 Digg
Digg Facebook
 Google+
 Reddit
 Twitter
