
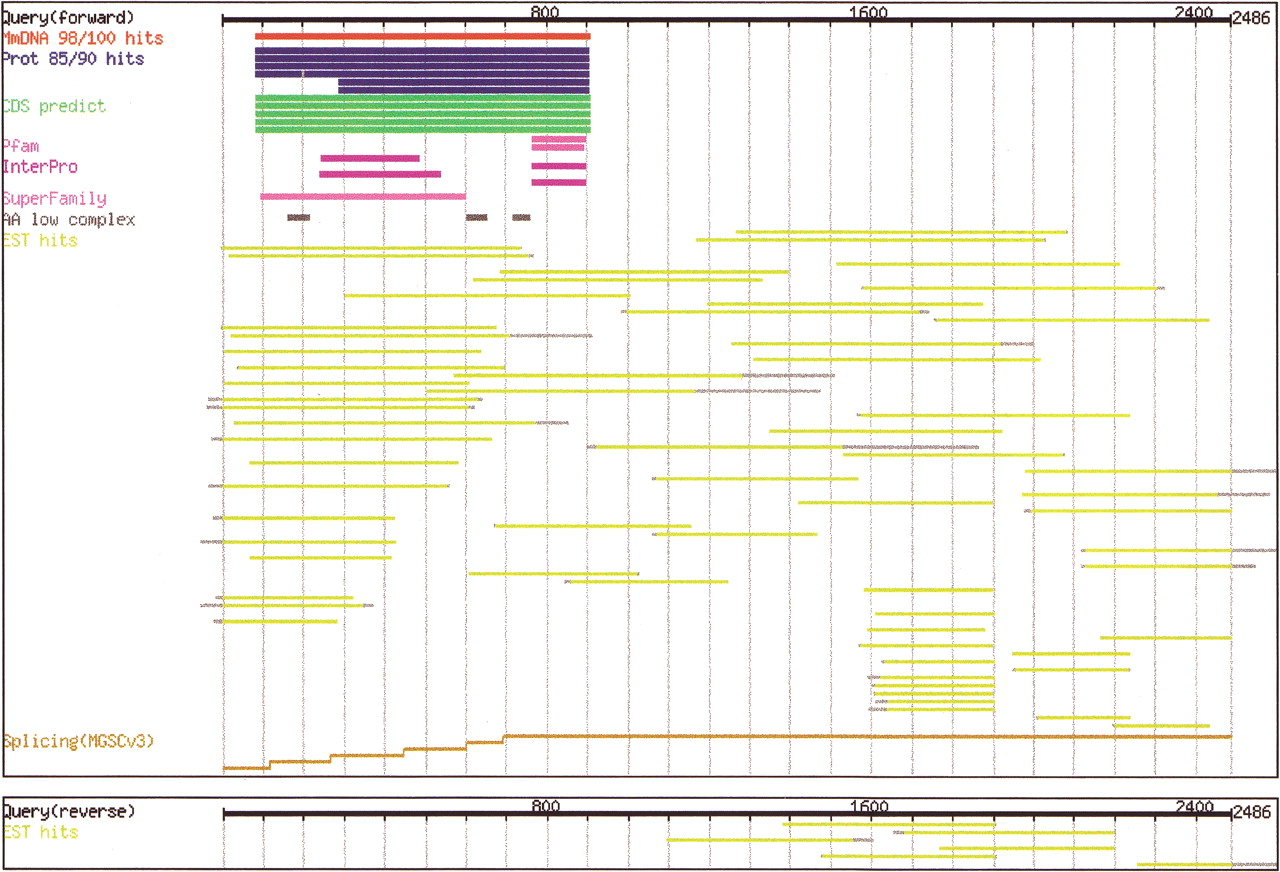
Figure 2
The CAS (cDNA Annotation System) presented as a graphic summary of the evidence supporting the annotation of the clone. Shown here are two panels with the evidence assigned to the forward and reverse strands, respectively. Black lines at the top of each panel represent query (cDNA) sequences. The color code is as follows: DNA hits, red; protein hits, blue; repetitive hits, dark gray; predicted CDS, green; motifs, purple; EST hits, yellow; and genome mapping segments (for identifying splicing), ocher. Light gray bars in the DNA or protein hits category indicate gapped regions in subject sequences.


