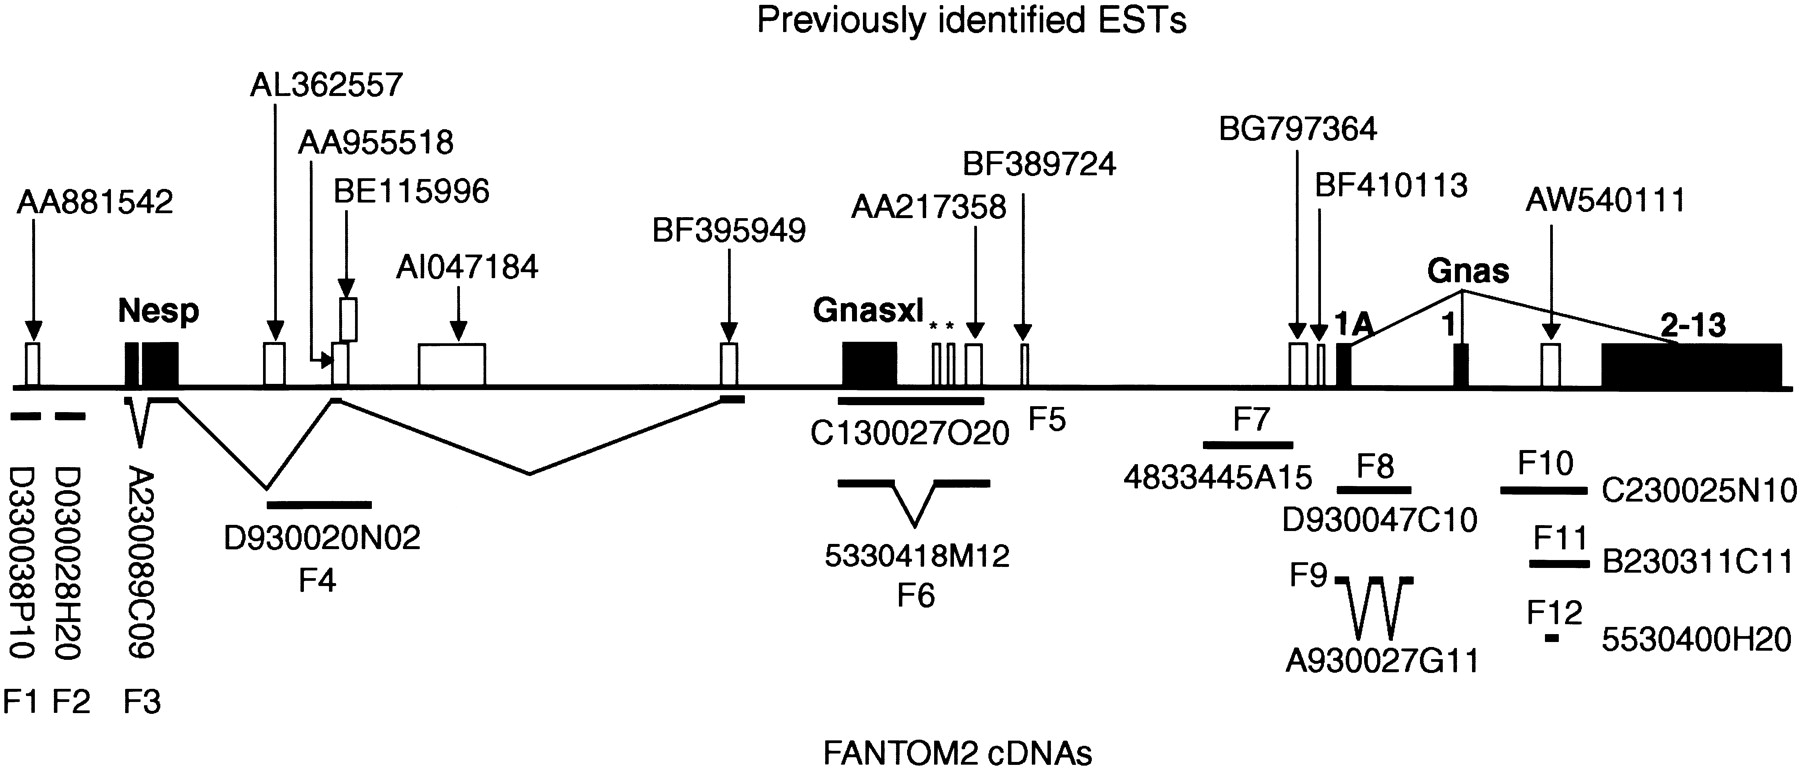
A Comprehensive Transcript Map of the Mouse Gnas Imprinted Complex

(Downloading may take up to 30 seconds. If the slide opens in your browser, select File -> Save As to save it.)

Click on image to view larger version.

Figure 1
Figure 1

Relative position of FANTOM2 cDNAs. Previously identifiedexons (solidboxes) and ESTs (open boxes) are shown above the line and FANTOM2 clones below. Asterisks indicate regions of homology to human A20 and A21 exons. Figure not to scale.

This Article

  1. Genome Res. 13: 1410-1415

Preprint Server