
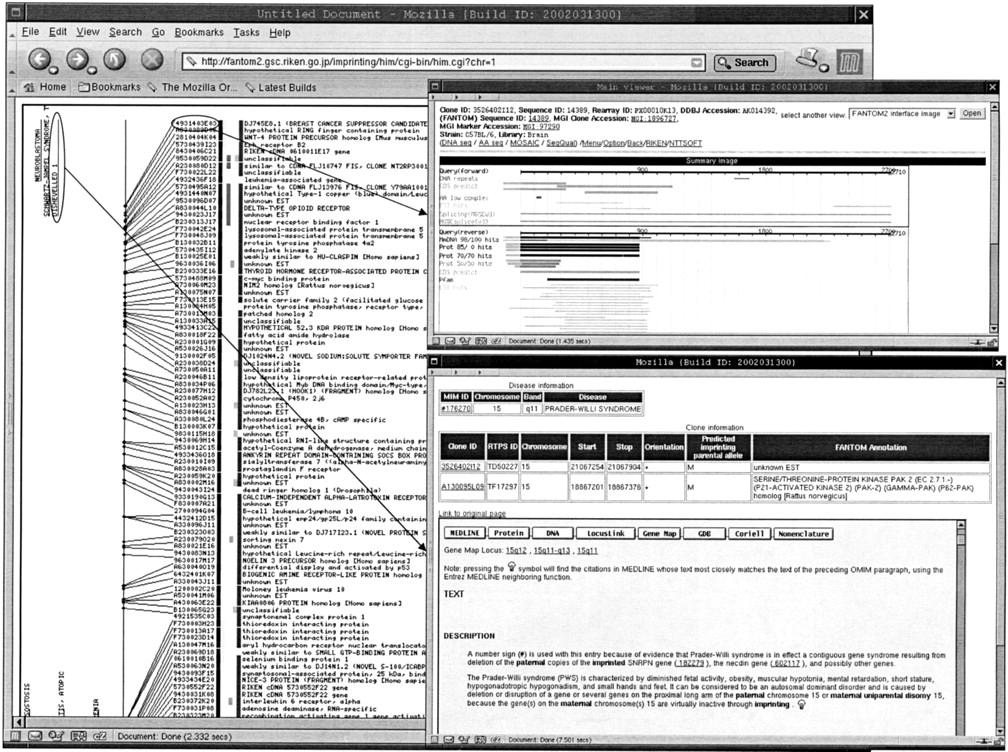
Predicted imprinted transcript map of human chromosome 1 A snap shot from the predicted imprinted transcript map (http://fantom2.gsc.riken.go.jp/imprinting/) is shown. (Left) The chromosome 15 and the mapped transcripts. On the left side of the chromosome, human imprinted gene region was shown. There is a link to the disease information (bottom, right). RIKEN clone ID that has been mapped to the chromosome has a link to the FANTOM2 viewer (top, right). There are six color boxes in between the RIKEN clone ID and the annotation as shown at left. The first color box shows whether the transcript is maternally expressed (red) or paternally expressed (blue). The second box shows whether the transcript is mapped to the human imprinted disease loci (yellow). If yes, the color box is painted in yellow. The third-fifth boxes show whether the transcript overlaps with the mouse imprint region (orange), natural antisense transcript (green), or ncRNA(blue) as shown in Figure 1(Venn diagram). The sixth box shows whether the position on human genome is confirmed by mouse human homology map (Gregory et al. 2002) (fuchsia).


