
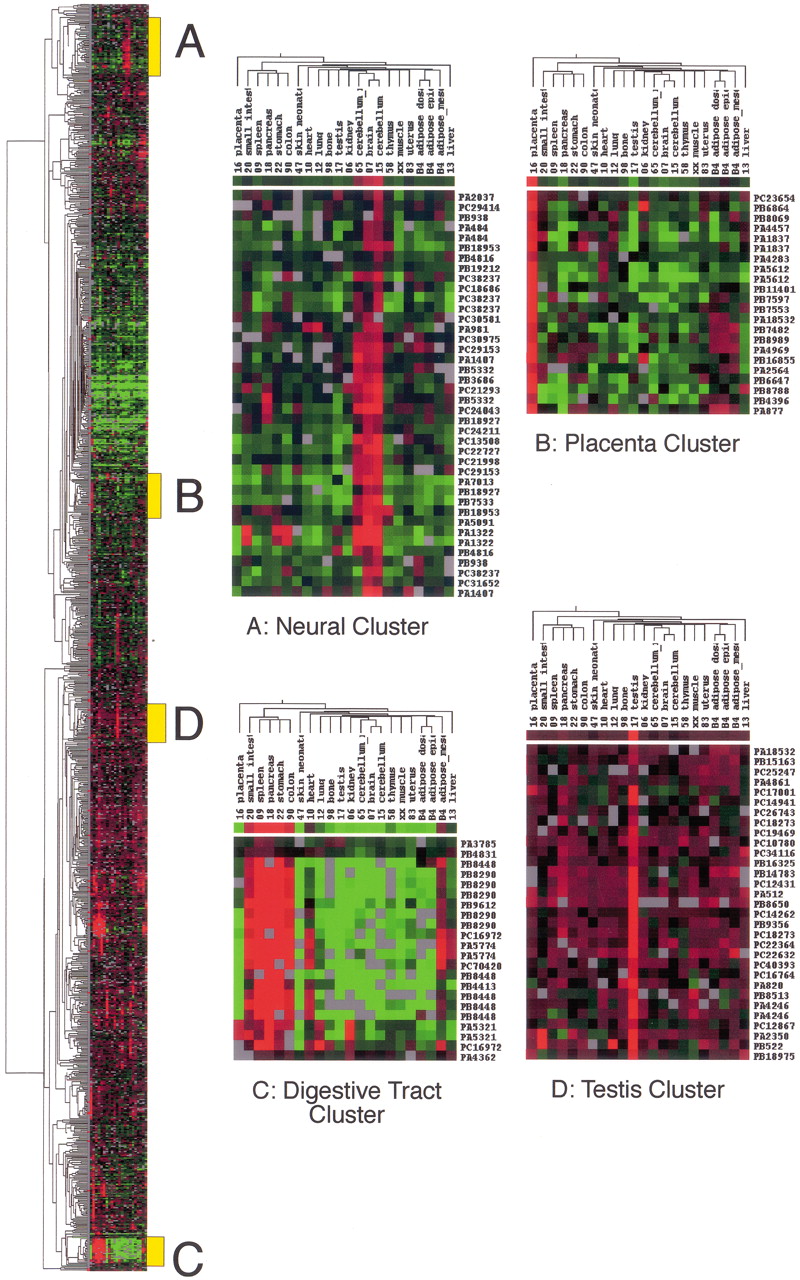
Hierarchical clustering of gene expression data for 970 FANTOM2 cDNAs encoding secretome proteins across 22 mouse tissues. Results are presented in a dendrogram displaying related groups of genes (on the Y-axis) and tissues (on the X-axis). The relative expression of each cDNA is represented as a log2 ratio of hybridization signals between each tissue and a common reference mRNA sample (total 17.5 dpc mouse embryo). Blocks of red signal indicate high levels of expression in the tissue relative to the reference RNA. Blocks of green signify low levels of expression relative to the reference RNA. Grey blocks indicate data points that are missing. Along the right-hand side of the dendrogram are several yellow boxes labeled A to D, which define the location of four tissue-restricted clusters. (A) Neural restricted cluster. (B) Placenta cluster. (C) Digestive tract cluster. (D) Testis cluster.


