
Figure 2
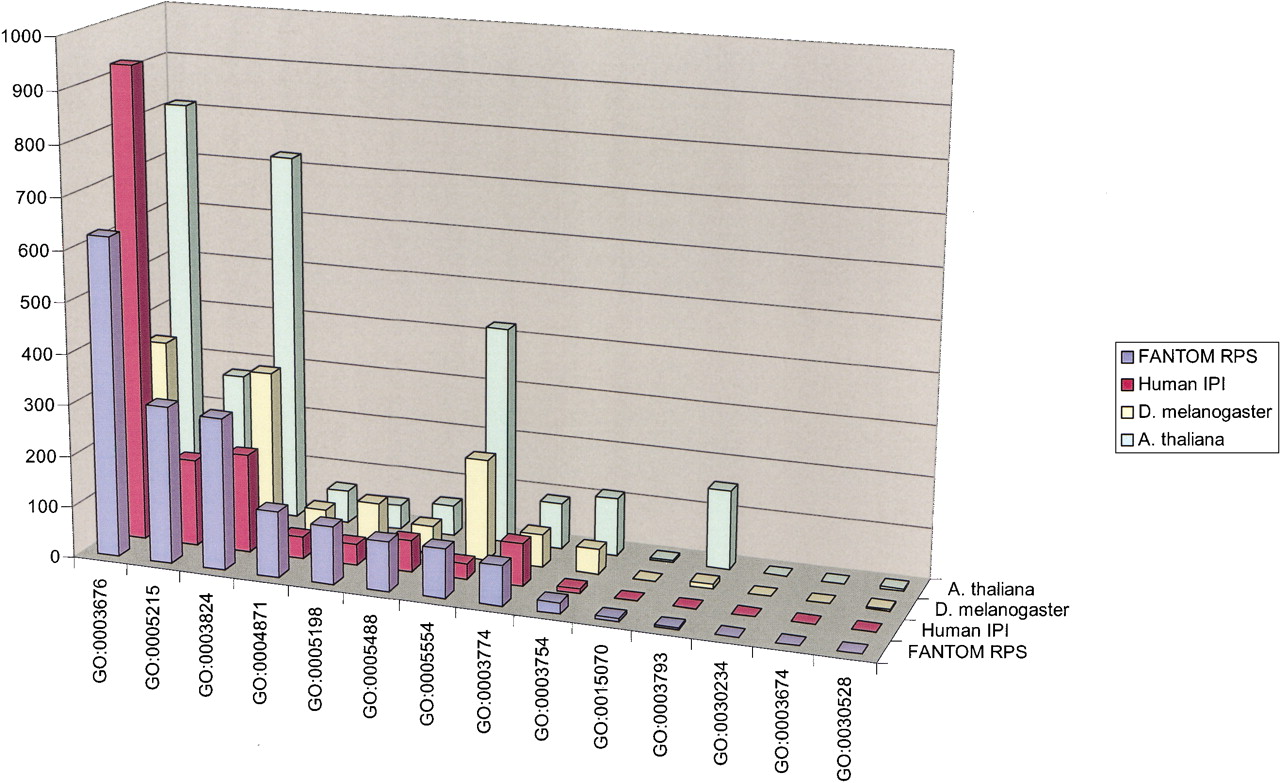
Comparative diagram of the GO Slim categories for different eukaryotic proteomes. The y-axis shows the number of proteins; the x-axis shows GO categories (see Fig. 1).
(Downloading may take up to 30 seconds. If the slide opens in your browser, select File -> Save As to save it.)
Click on image to view larger version.
Comparative diagram of the GO Slim categories for different eukaryotic proteomes. The y-axis shows the number of proteins; the x-axis shows GO categories (see Fig. 1).
 CiteULike
 Delicious
 Digg
Digg Facebook
 Google+
 Reddit
 Twitter
