
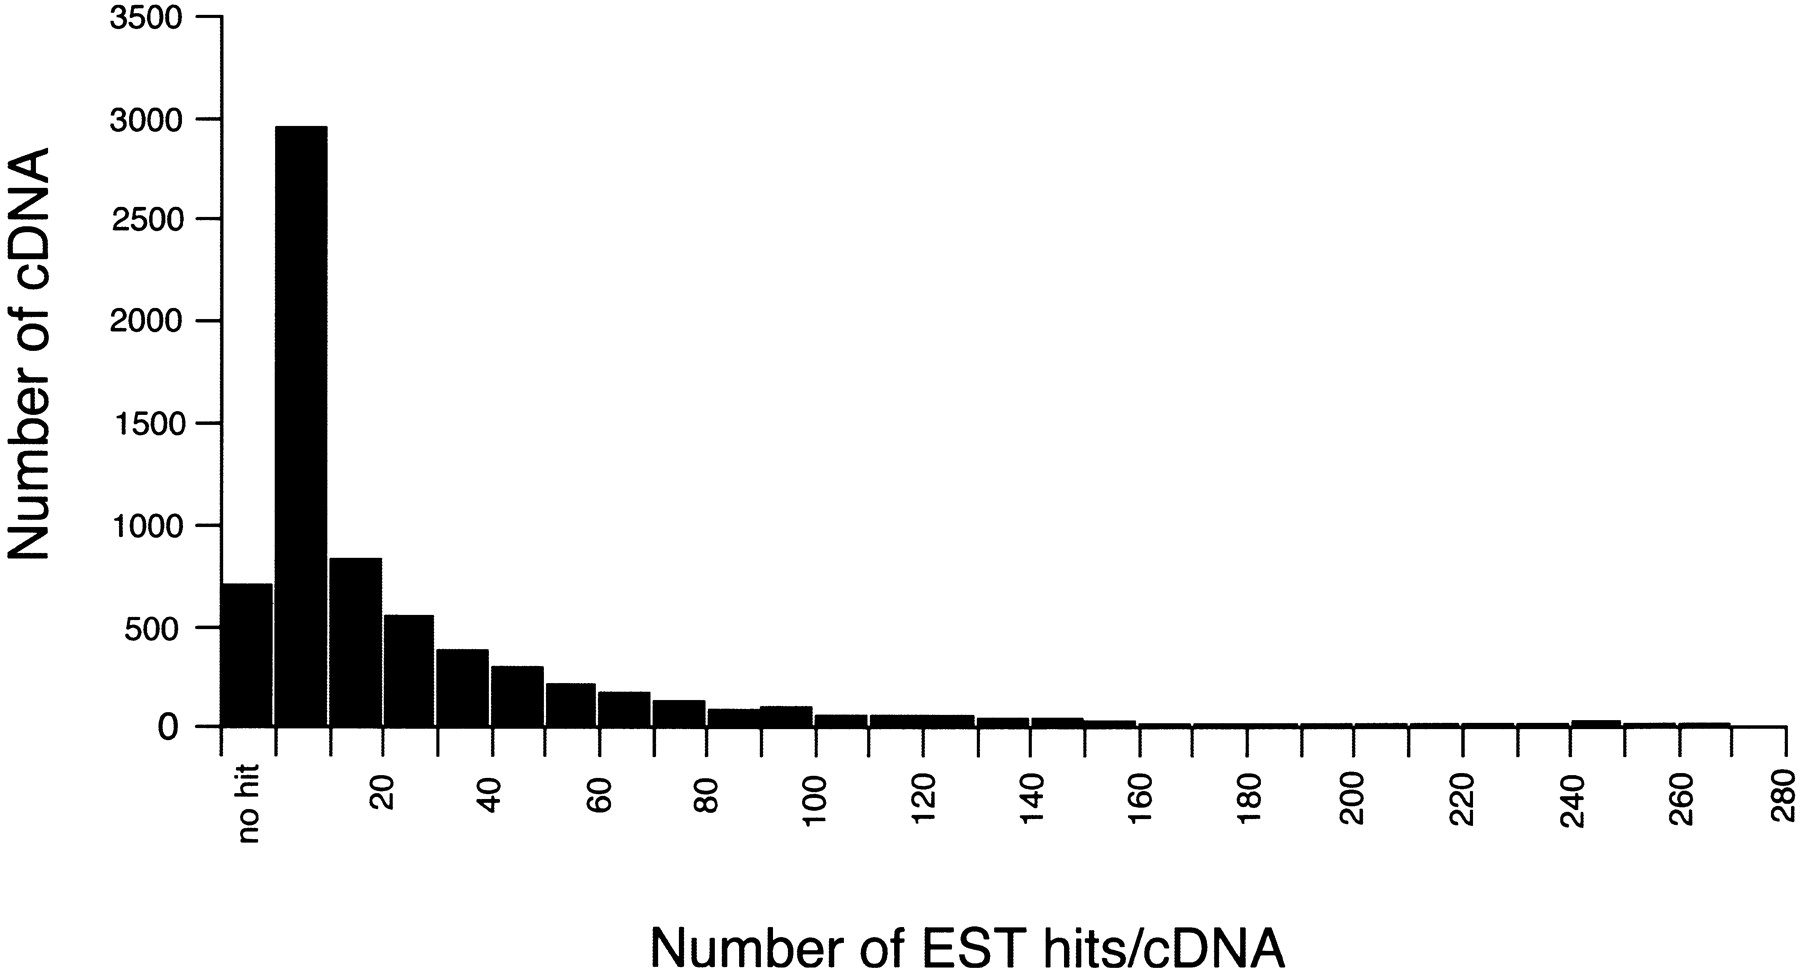
Figure 5
Histogram of number of EST hits distribution. The distribution of bidirectional transcription pair cDNA for the number of EST hits is shown. The horizontal axis represents the number of EST hits for each bidirectional transcription pair cDNA. The vertical axis represents the number of cDNA for each bin. We also analyzed distributions for sense–antisense transcript pairs and nonantisense bidirectional transcription pairs separately, but there was no significant difference between these distributions (data not shown).


