
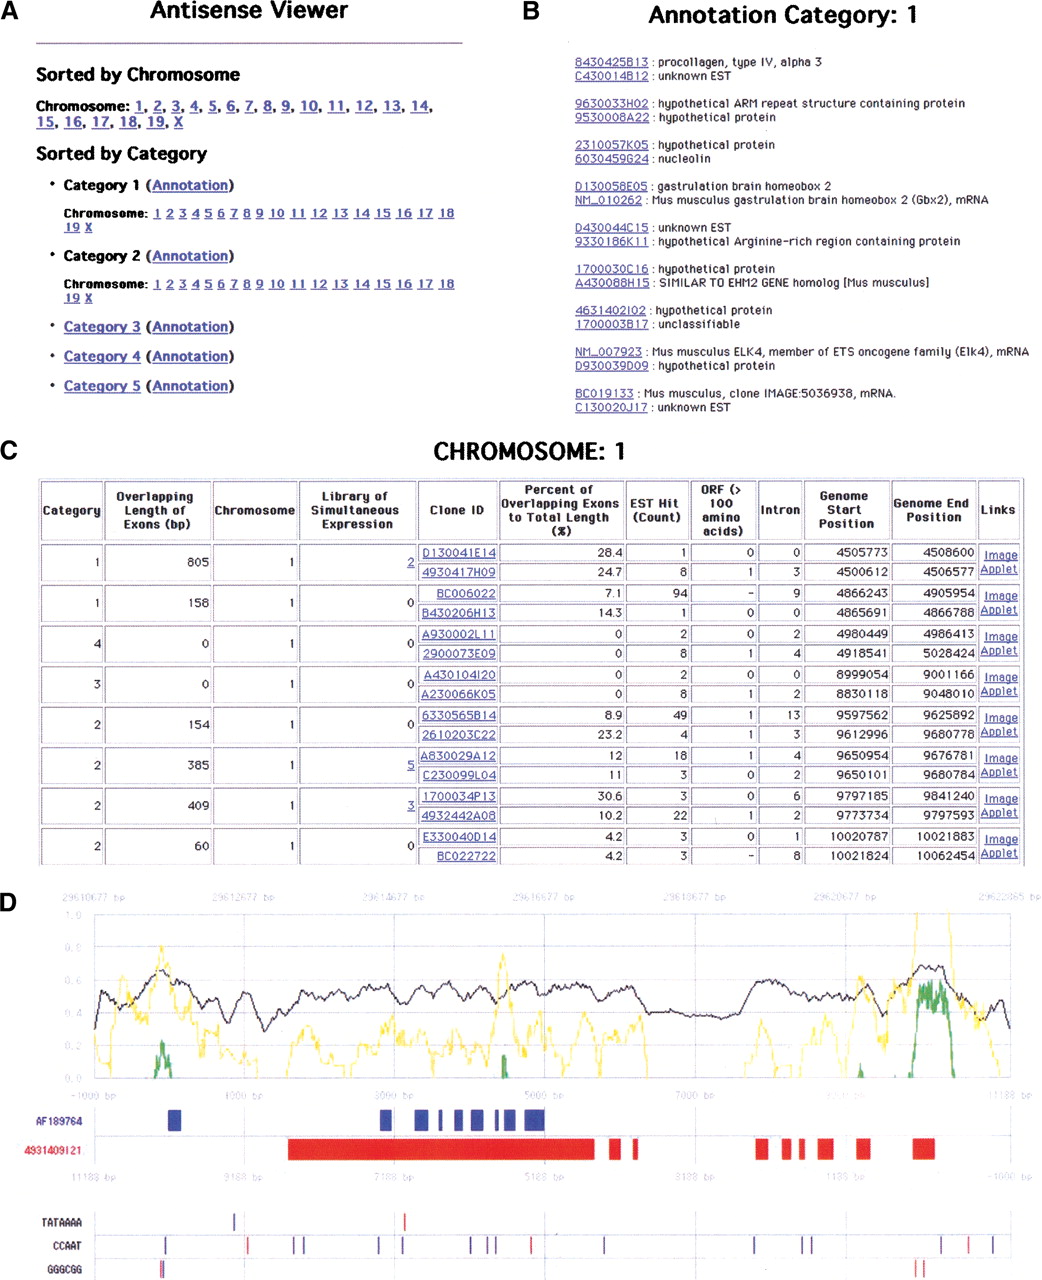
Examples of antisense viewer. All data of the bidirectional transcription pairs can be viewed at http://genome.gsc.riken.go.jp/m/antisense/viewer/. (A) Entrance of the viewer. The data are either sorted by chromosome or category. By clicking “Annotation,” the FANTOM2 annotation of each cDNA (B) will be shown. By clicking chromosome numbers or category numbers, the pages for the description of the bidirectional transcription pairs will be shown (C). (B) Gene names by FANTOM annotation are shown for each sense–antisense cDNA pairs. (C) Data for each bidirectional transcription pair are shown. By clicking either “Image” or “Applet,” graphical mapping patterns of cDNA on the genome sequences (D) will be presented. (D) Mapping patterns of bidirectional transcription cDNA pairs on the genome. Forward and reverse directions on the chromosomes are represented in blue and red colors, respectively. The filled boxes represent the positions of exons. The black line represents GC content along the genome sequences. The yellow and green lines represent a ratio of the observed to expected CpG score, and a final CpG score, respectively (please see the Methods section for a detailed calculation of these scores). The positions of major promoter consensus sequences are shown underneath the positions of exons.


