
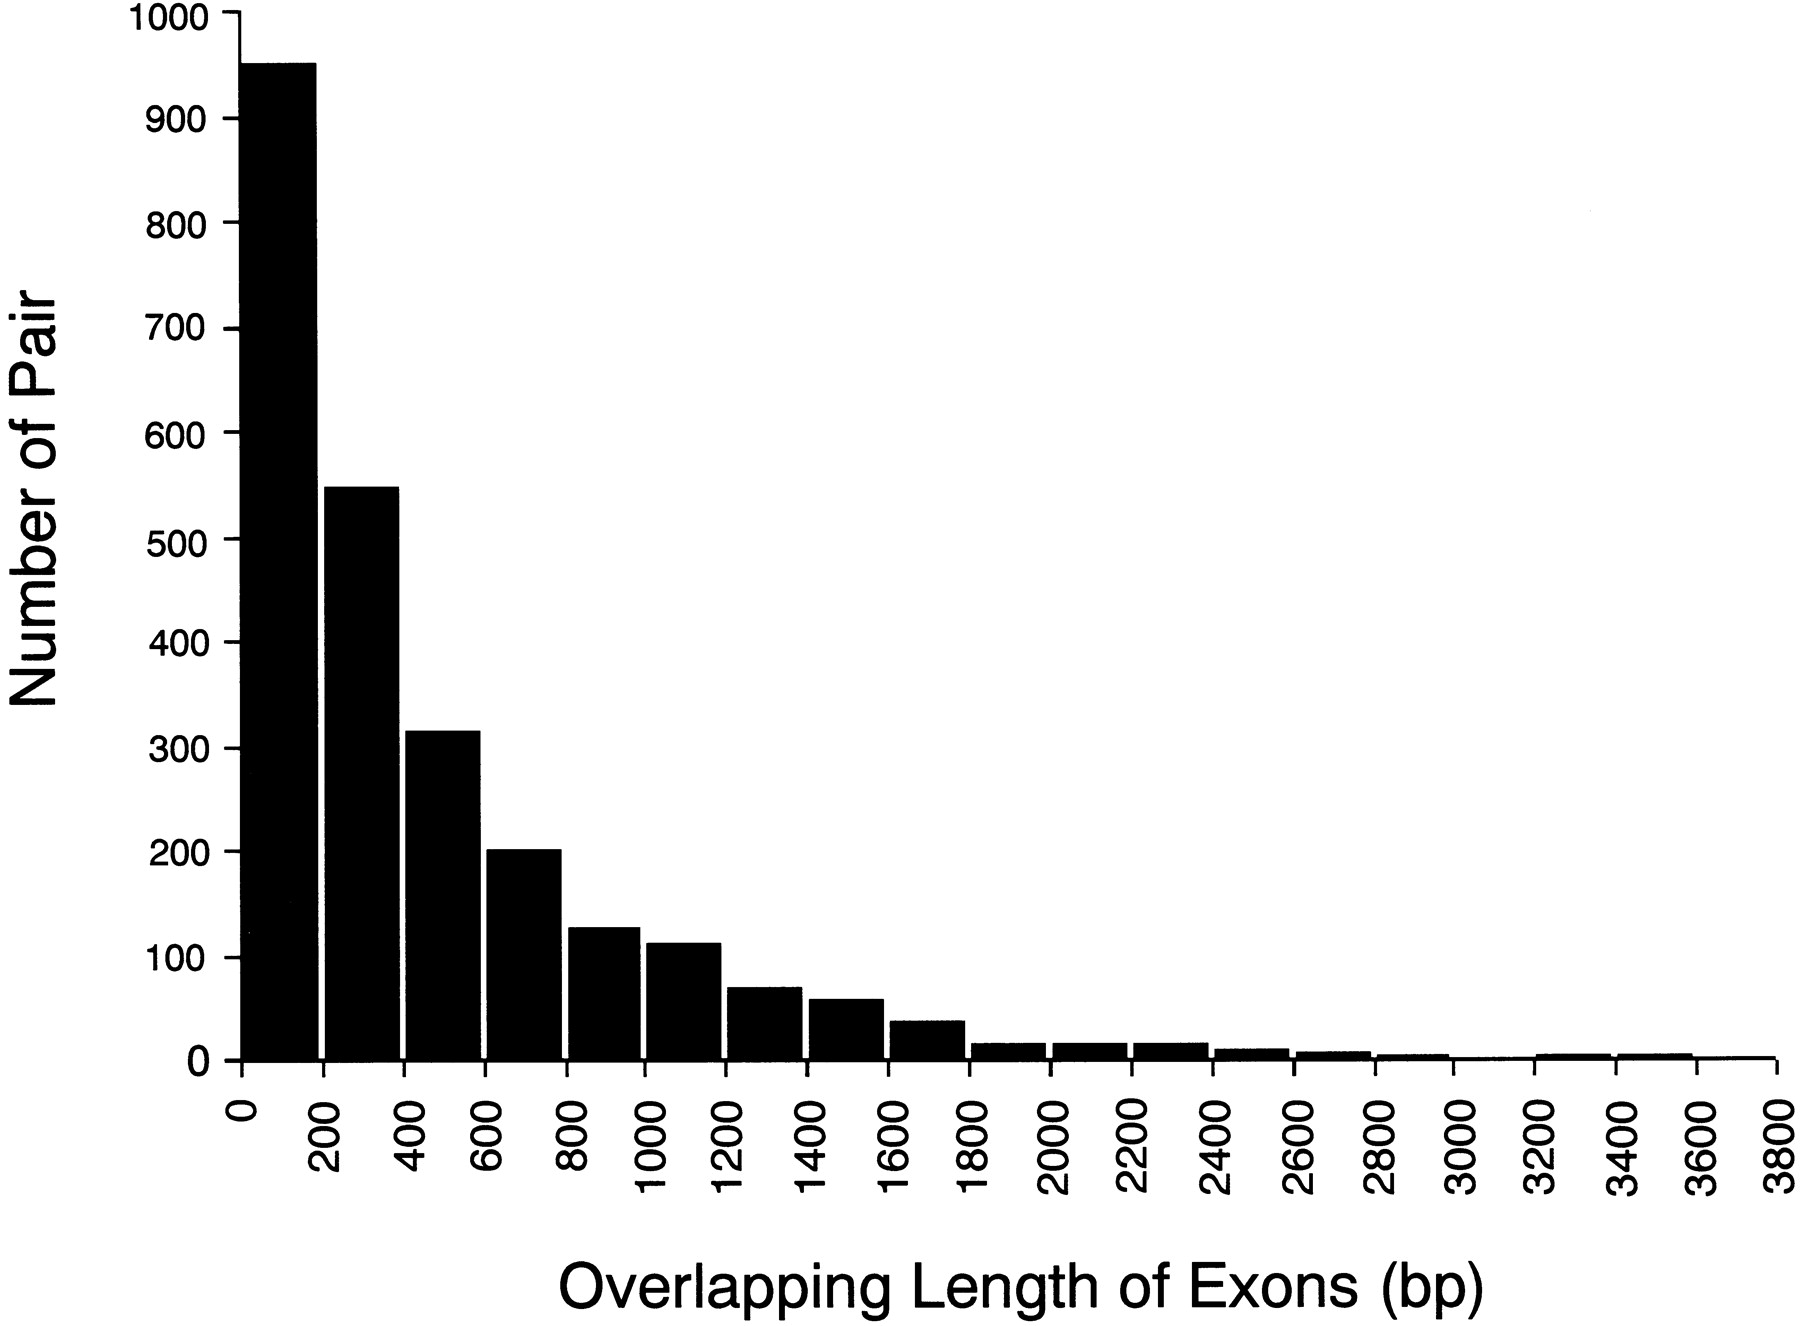
Figure 2
Histogram of overlapping length distribution. The distribution of sense–antisense transcript pairs for their overlapping length of exons is shown. The horizontal axis represents overlapping length (bp) of exons for each sense–antisense transcript pair. The vertical axis represents the number of pair for each bin.


