
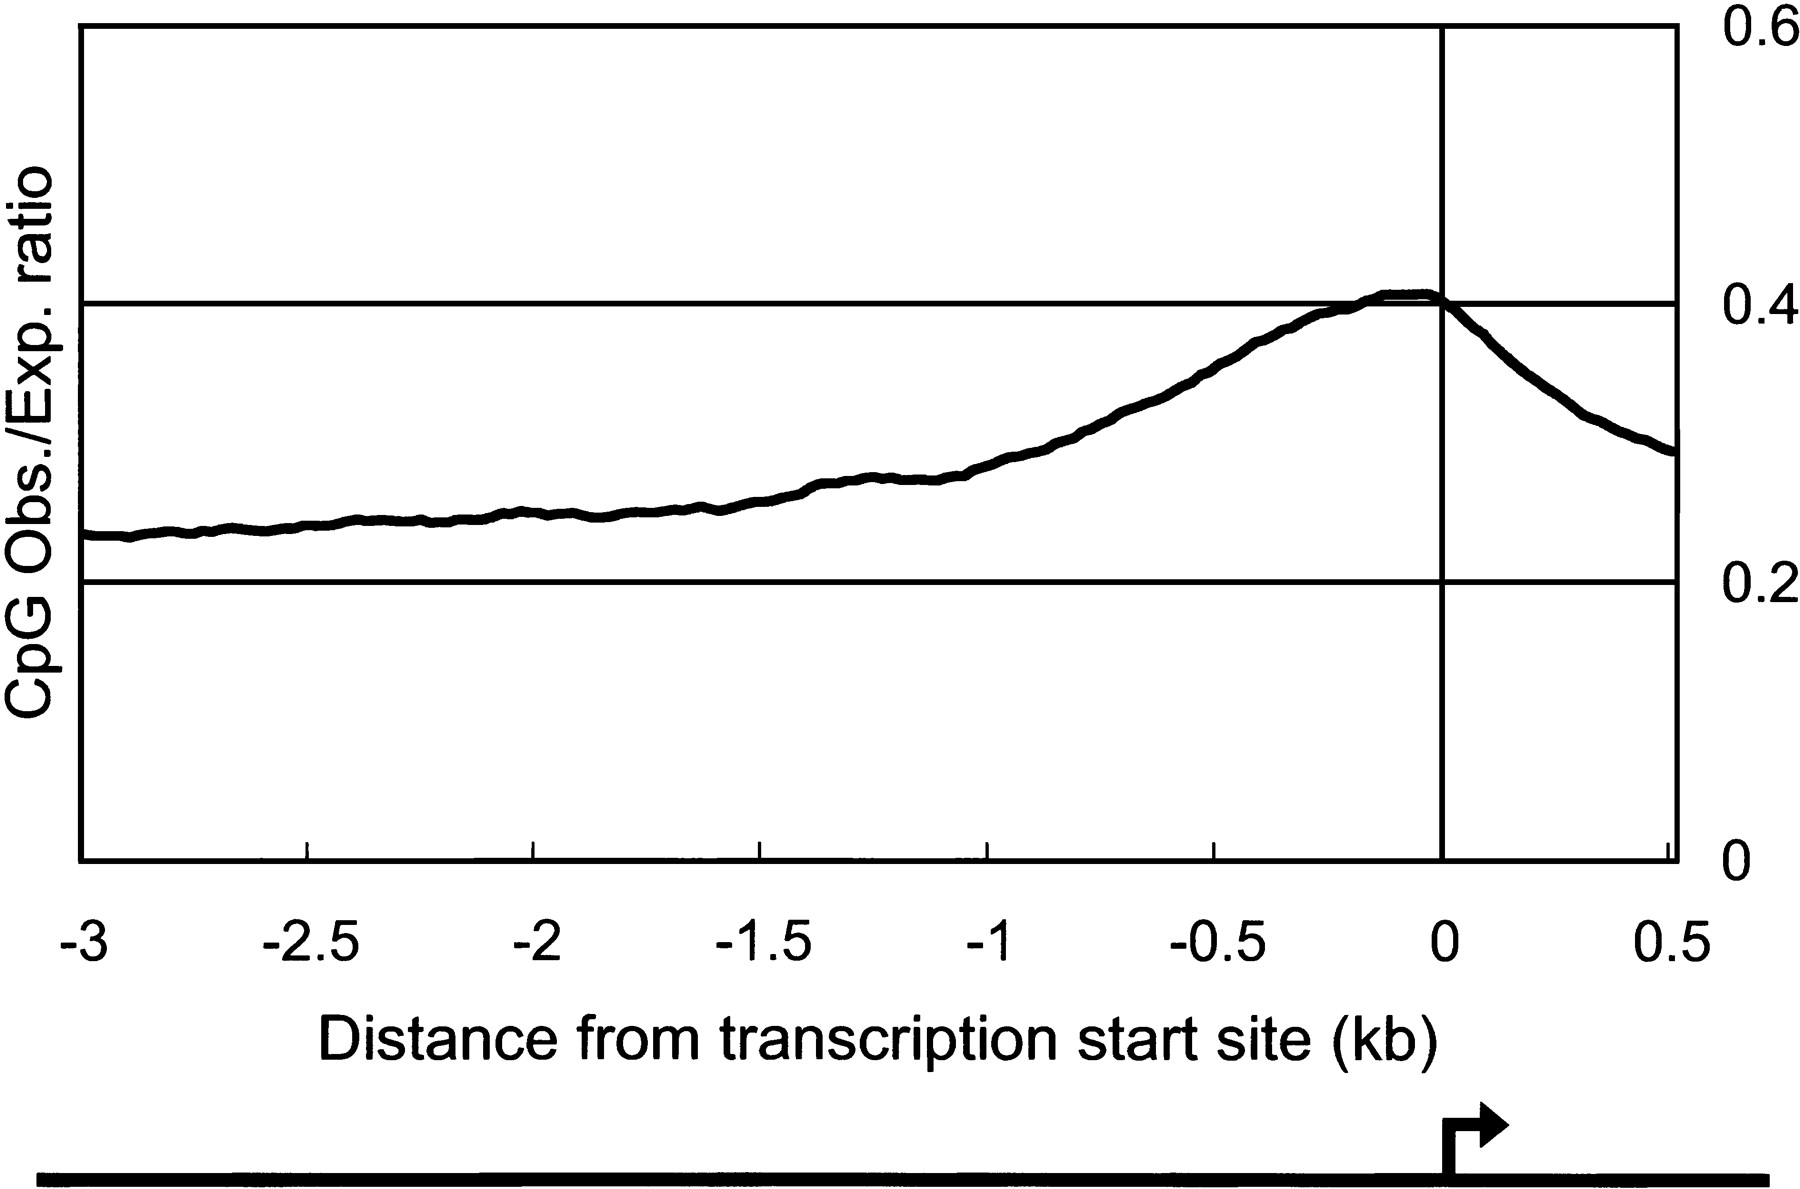
Figure 1
Average of CpG observed/expected (O/E) value around putative transcription start site. The average of CpG O/E ratio for each transcription start site (from 3 kb upstream to 0.5 kb downstream) of the 4280 largest-candidate set was plotted. The set contains 919 sequences, which have potential CpG islands surrounding transcription start site, as referred in Table 3. Putative transcription start sites (TSSs) were defined by 5′ boundaries of mapped genomic regions as indicated by an arrow. CpG O/E ratio was calculated every 200-bp window with sliding 20 bp. The formula for producing CpG O/E ratio is described in Methods.


