
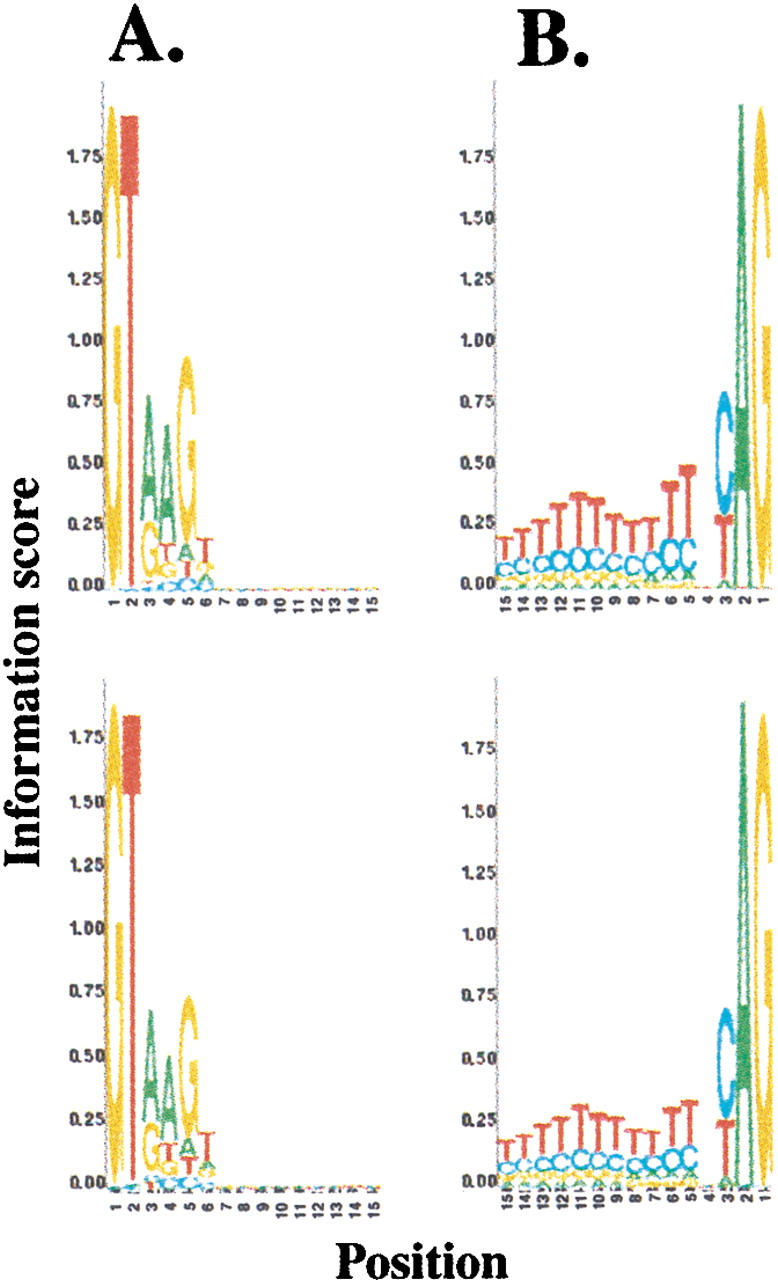
Figure 3
Nucleotide distribution in the (A,C) 5′- and (B,D) 3′-splice signals flanking constitutive (upper panels) and cryptic (lower panels) exons. The relative sizes of the letters indicate the relative frequencies of the nucleotides at that distance from the splice junctions. The absolute sizes of the letters correspond to the information score of the nucleotide distribution at that position.


