
Figure 1
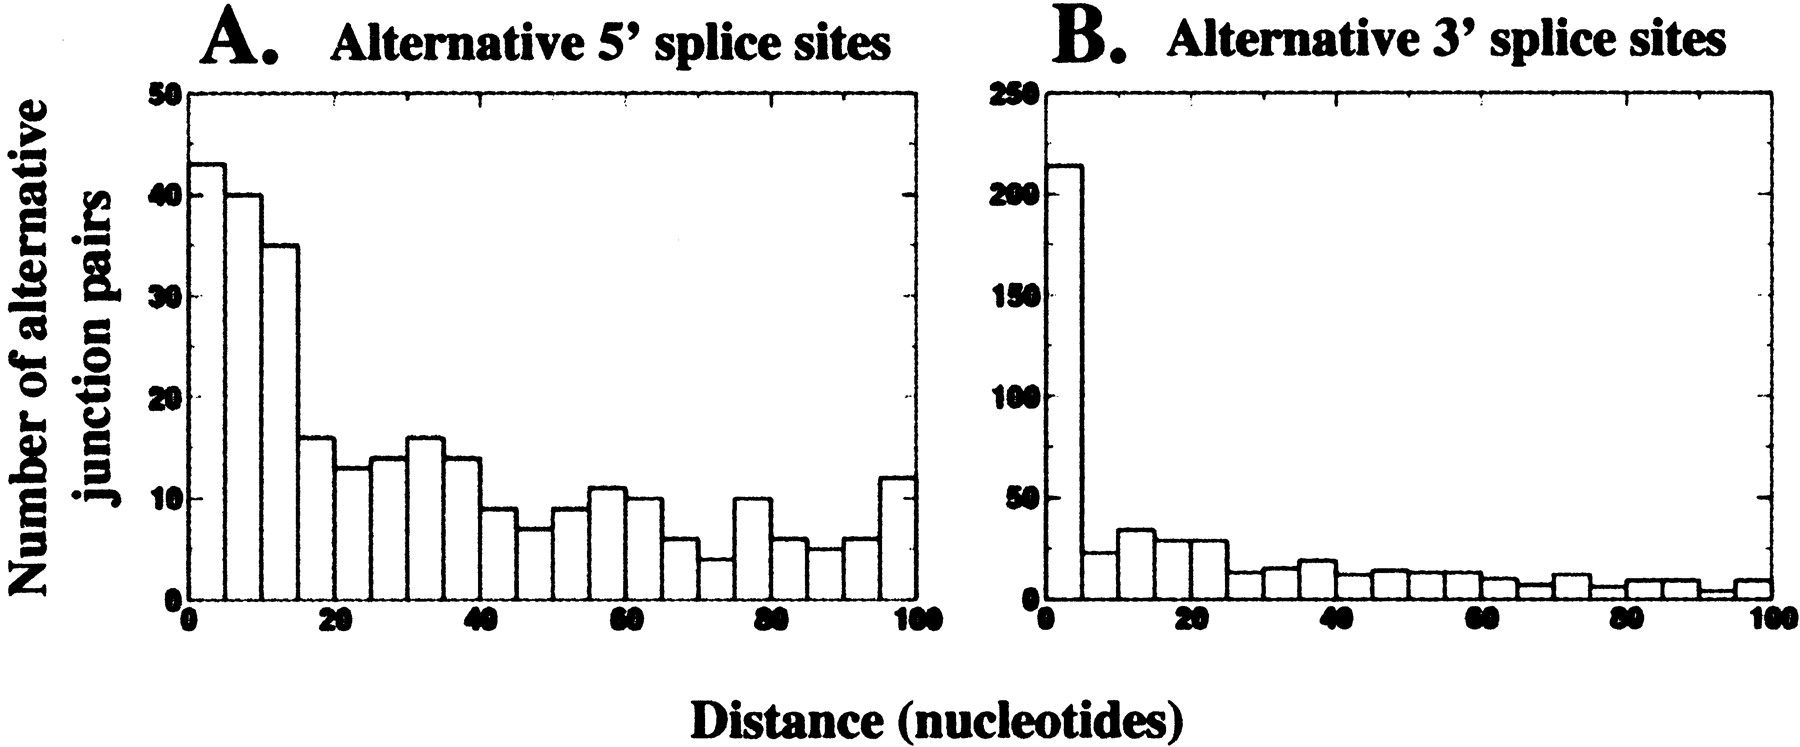
Distribution of distances between alternative splice sites: (A) 5′-splice sites; (B) 3′-splice sites. Note that we only show the distribution up to a distance of 100 nt.
(Downloading may take up to 30 seconds. If the slide opens in your browser, select File -> Save As to save it.)
Click on image to view larger version.
Distribution of distances between alternative splice sites: (A) 5′-splice sites; (B) 3′-splice sites. Note that we only show the distribution up to a distance of 100 nt.
 CiteULike
 Delicious
 Digg
Digg Facebook
 Google+
 Reddit
 Twitter
