
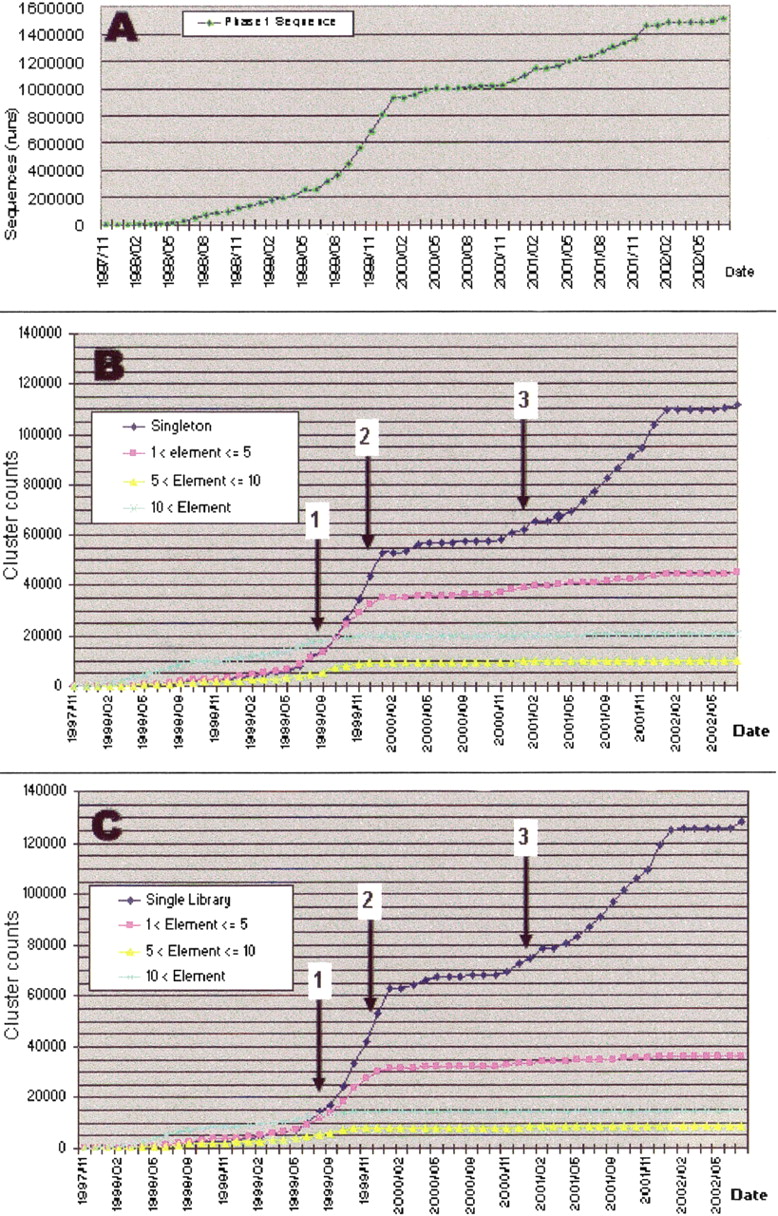
Figure 3
In the course of the gene discovery project (top), we monitored the appearance of singletons vs. clusters of various classes of size (middle) and number of libraries in which they appeared (bottom). Arrows 1, 2, and 3 show the date when increasingly larger subtracting drivers, respectively, consisted of 13,500, 37,500, and 126,000 rearrayed clusters, and were introduced for cDNA library subtraction.


