
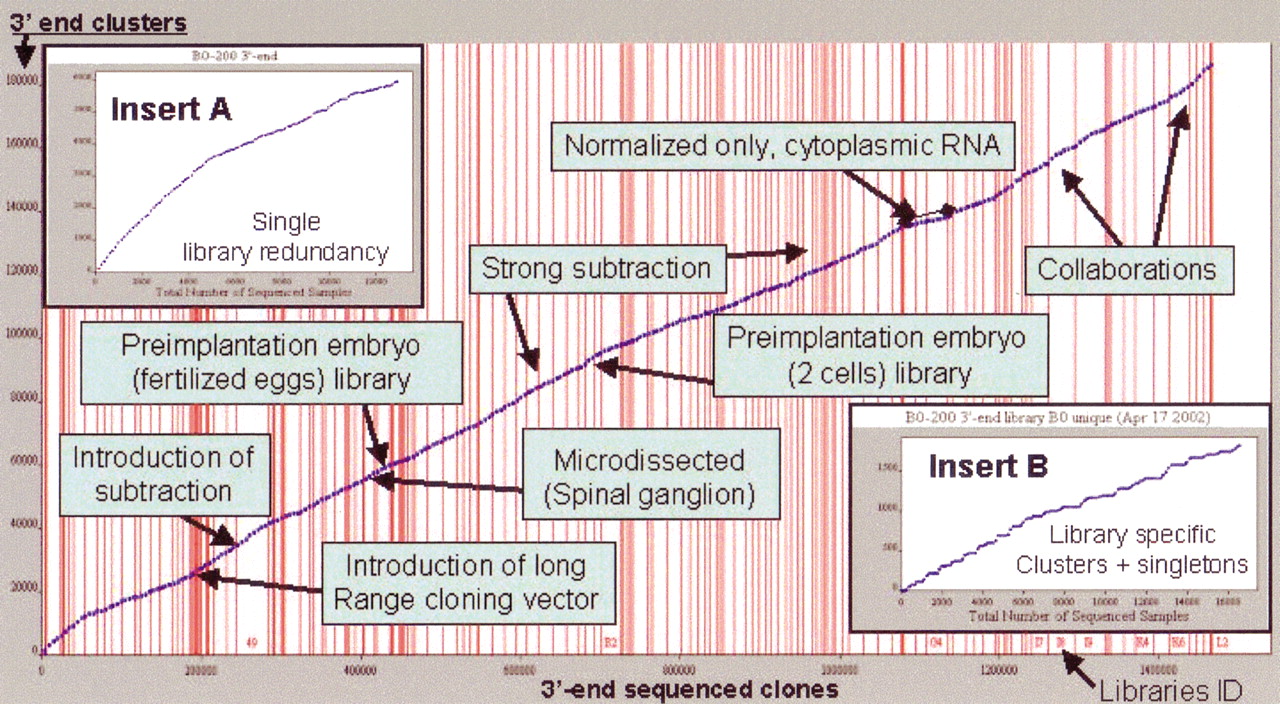
Overall sequencing growth during the course of the project: x axis shows the number of sequences and y the number of 3′ clusters. Vertical lines indicate switches between sequenced libraries. Strong subtraction is intended with RoT larger than 2000 and up to 500. Library number is displayed only when space allows. We highlighted the most productive factors that influenced gene discovery. (Top, left, inset) The internal redundancy of one library and (bottom, left, inset) the number of library specific clusters plus singletons (the gene discovery rate per library). The overall curve is derived by summing many curves as in B. (A, B) The B0 library, 2-cell stage.


