
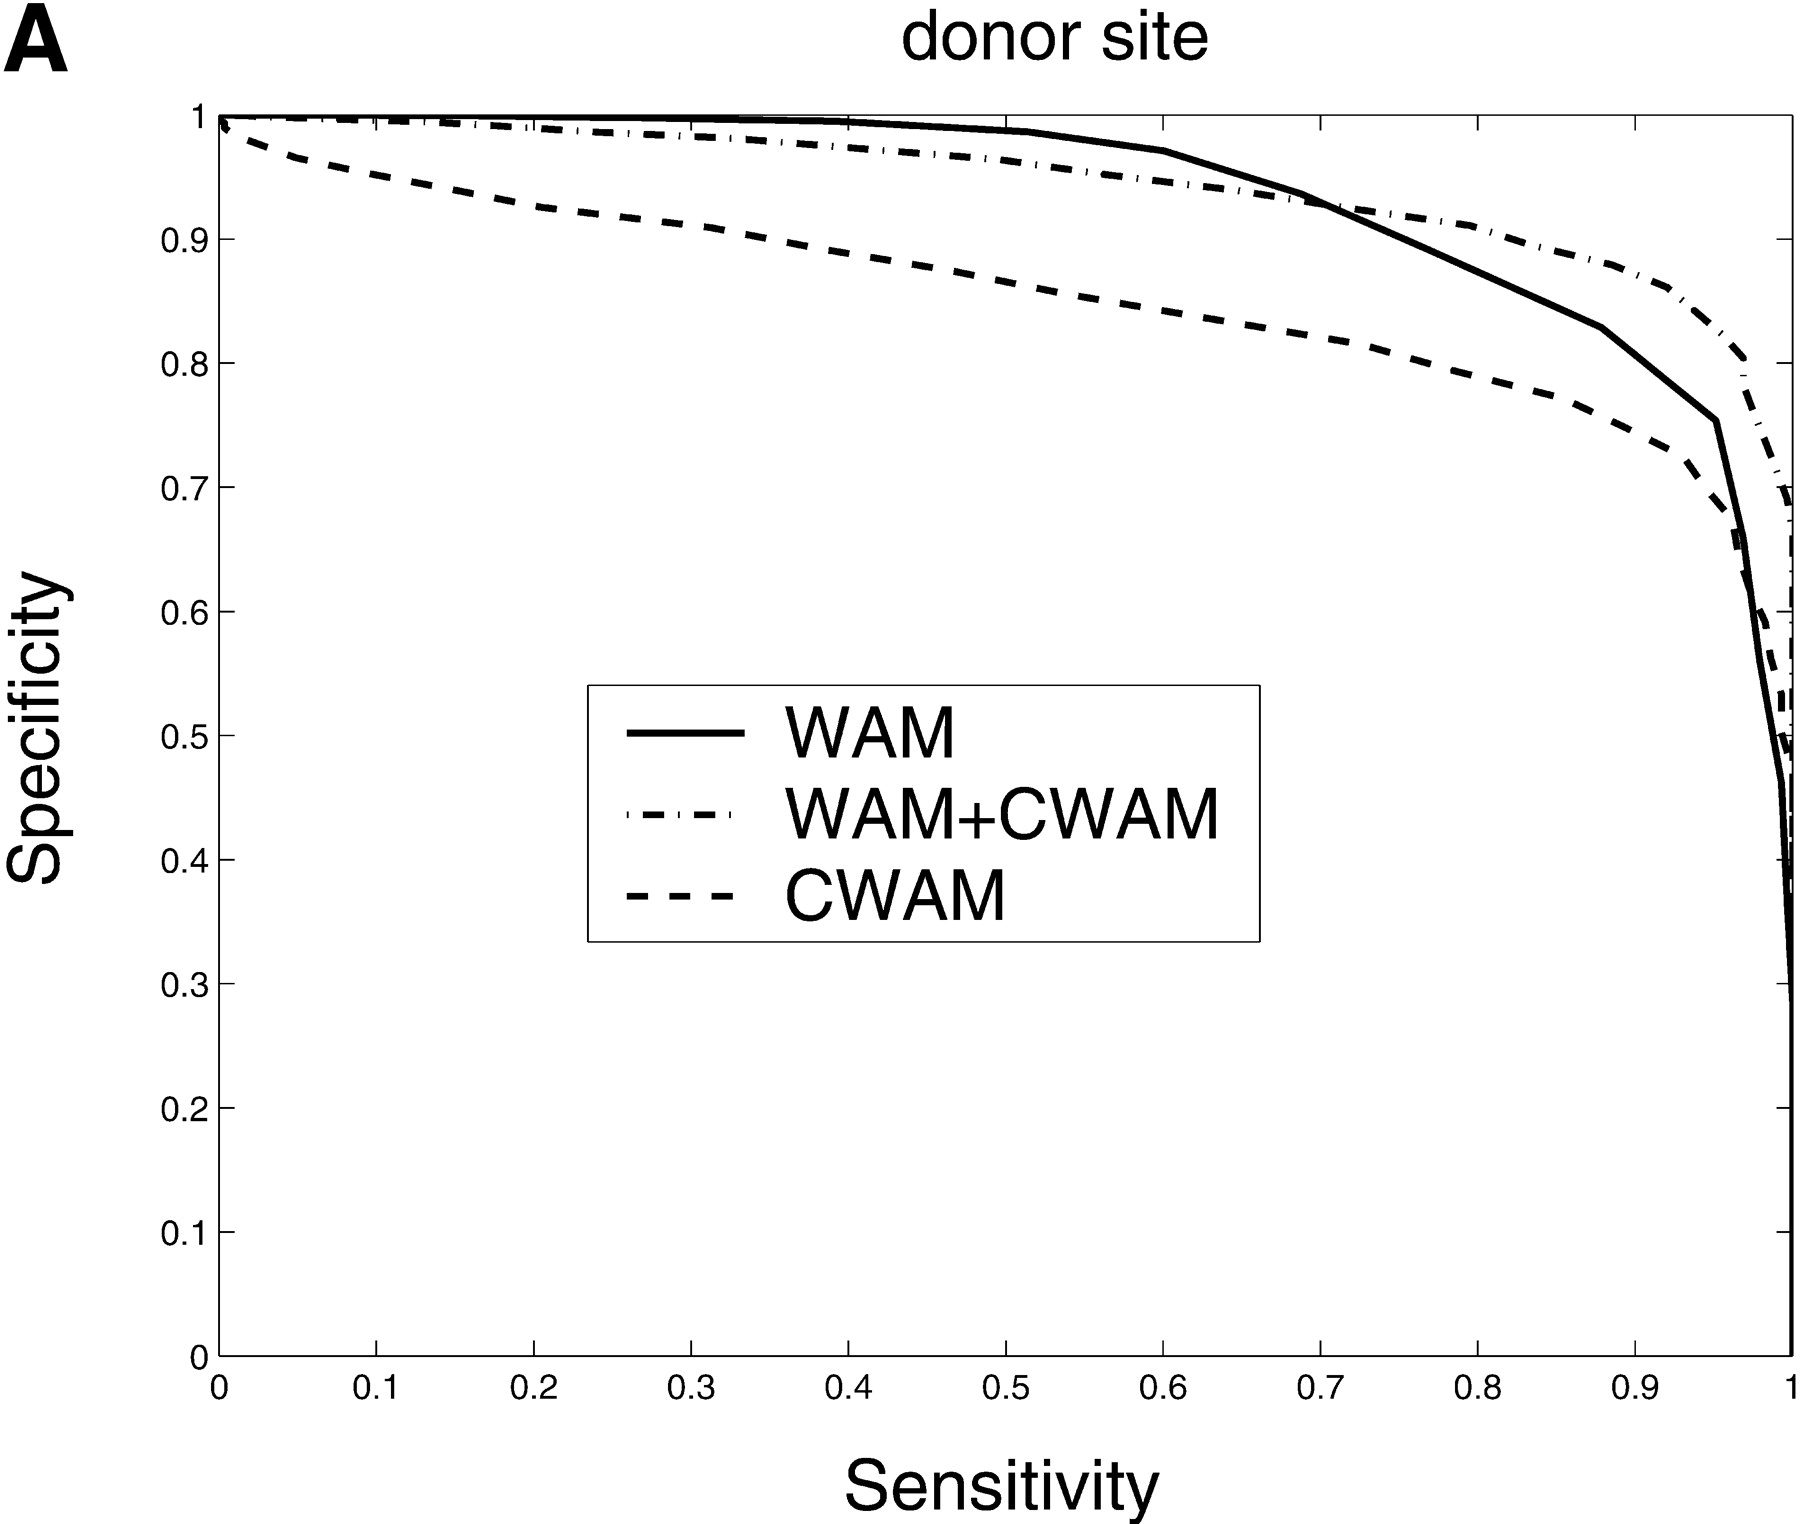
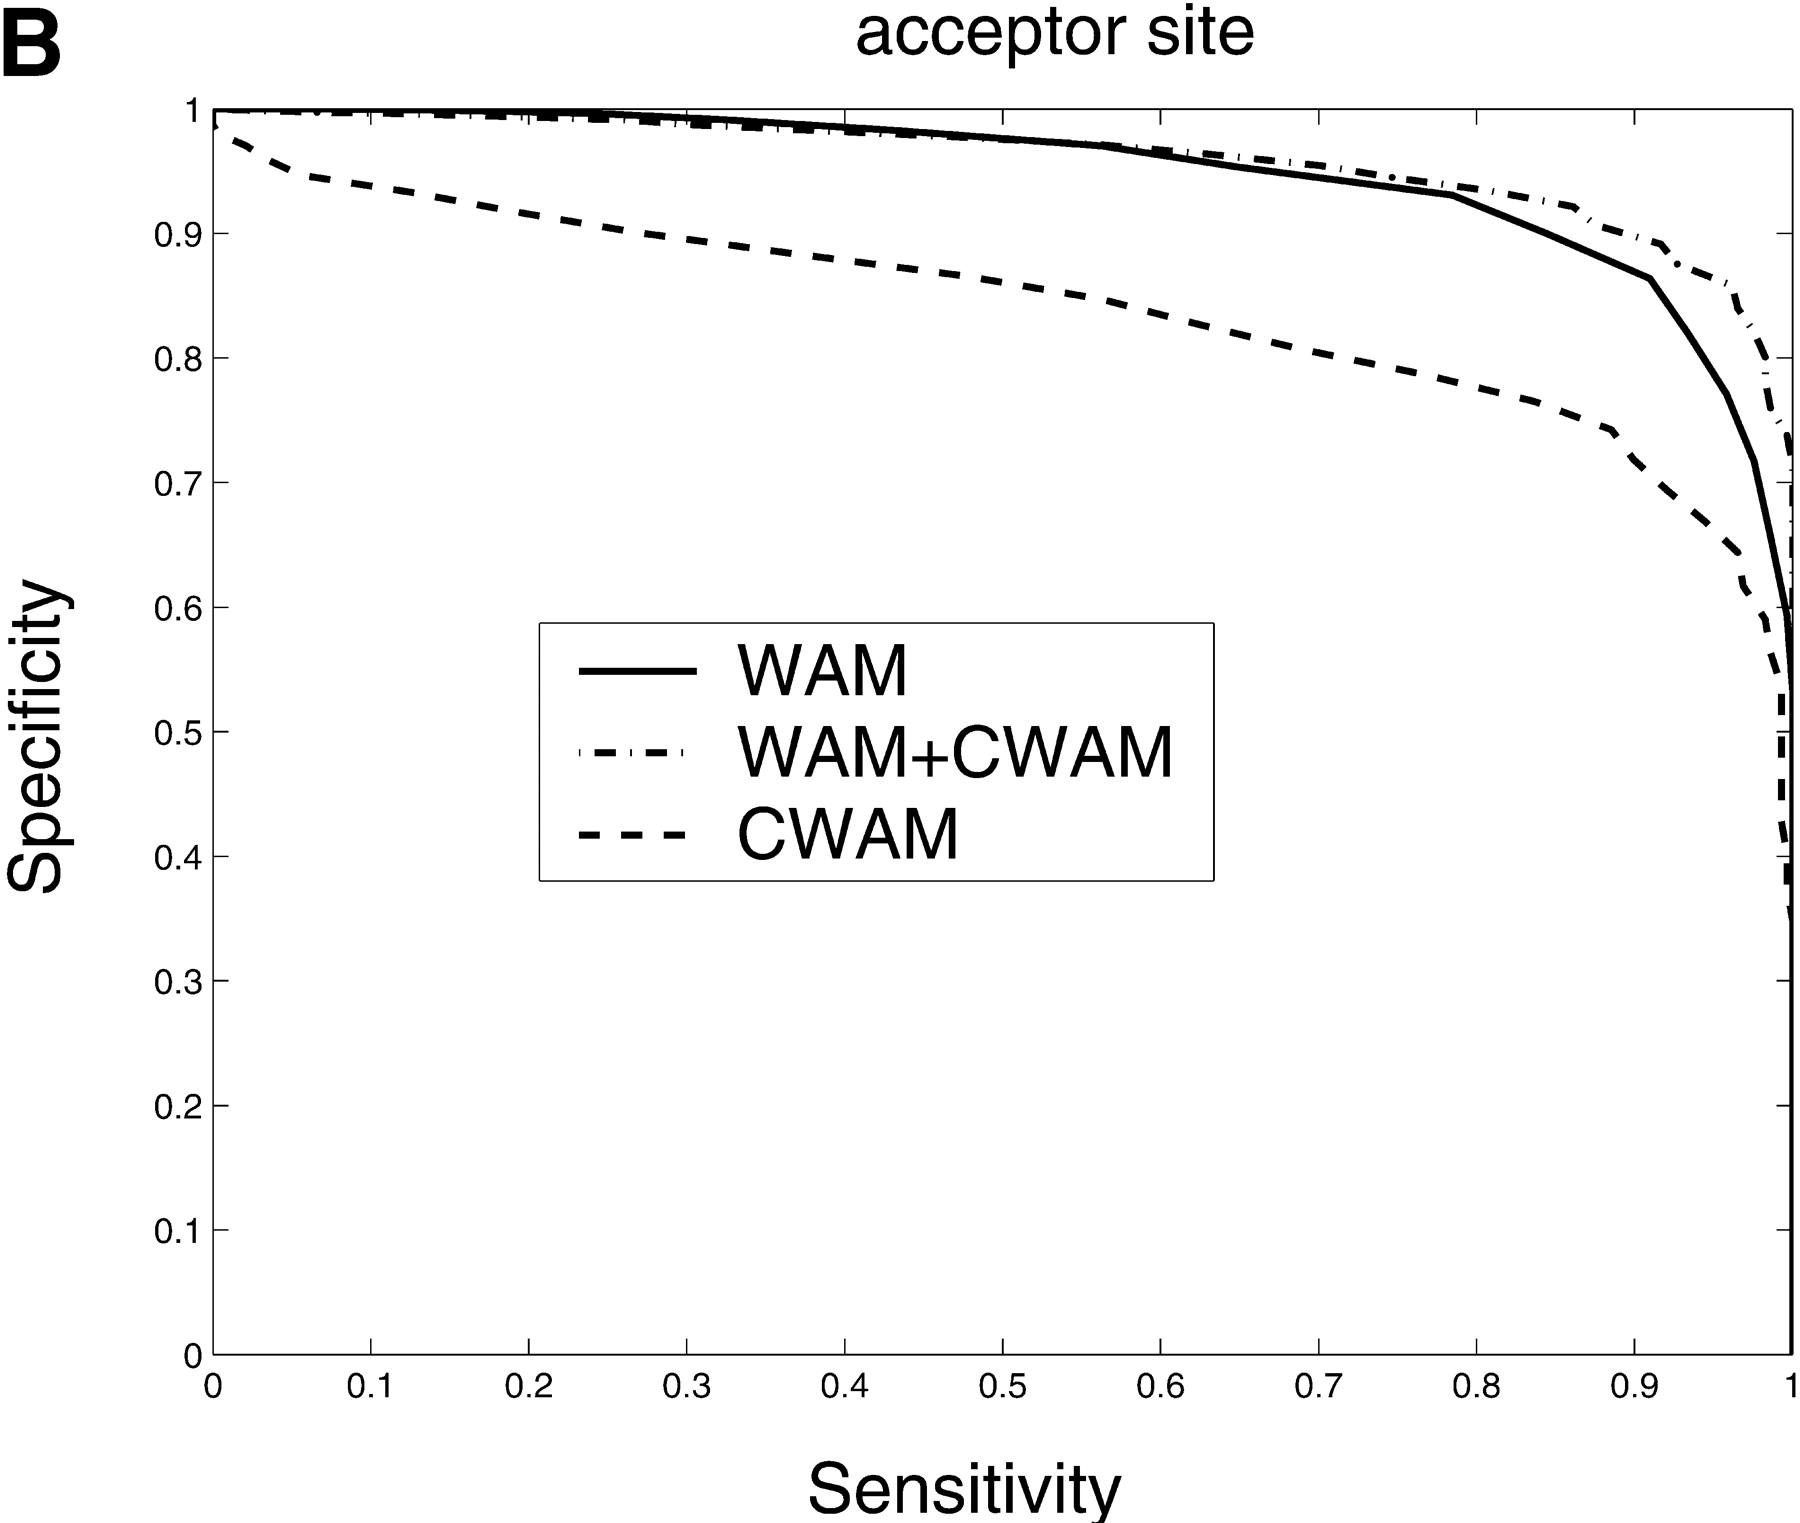
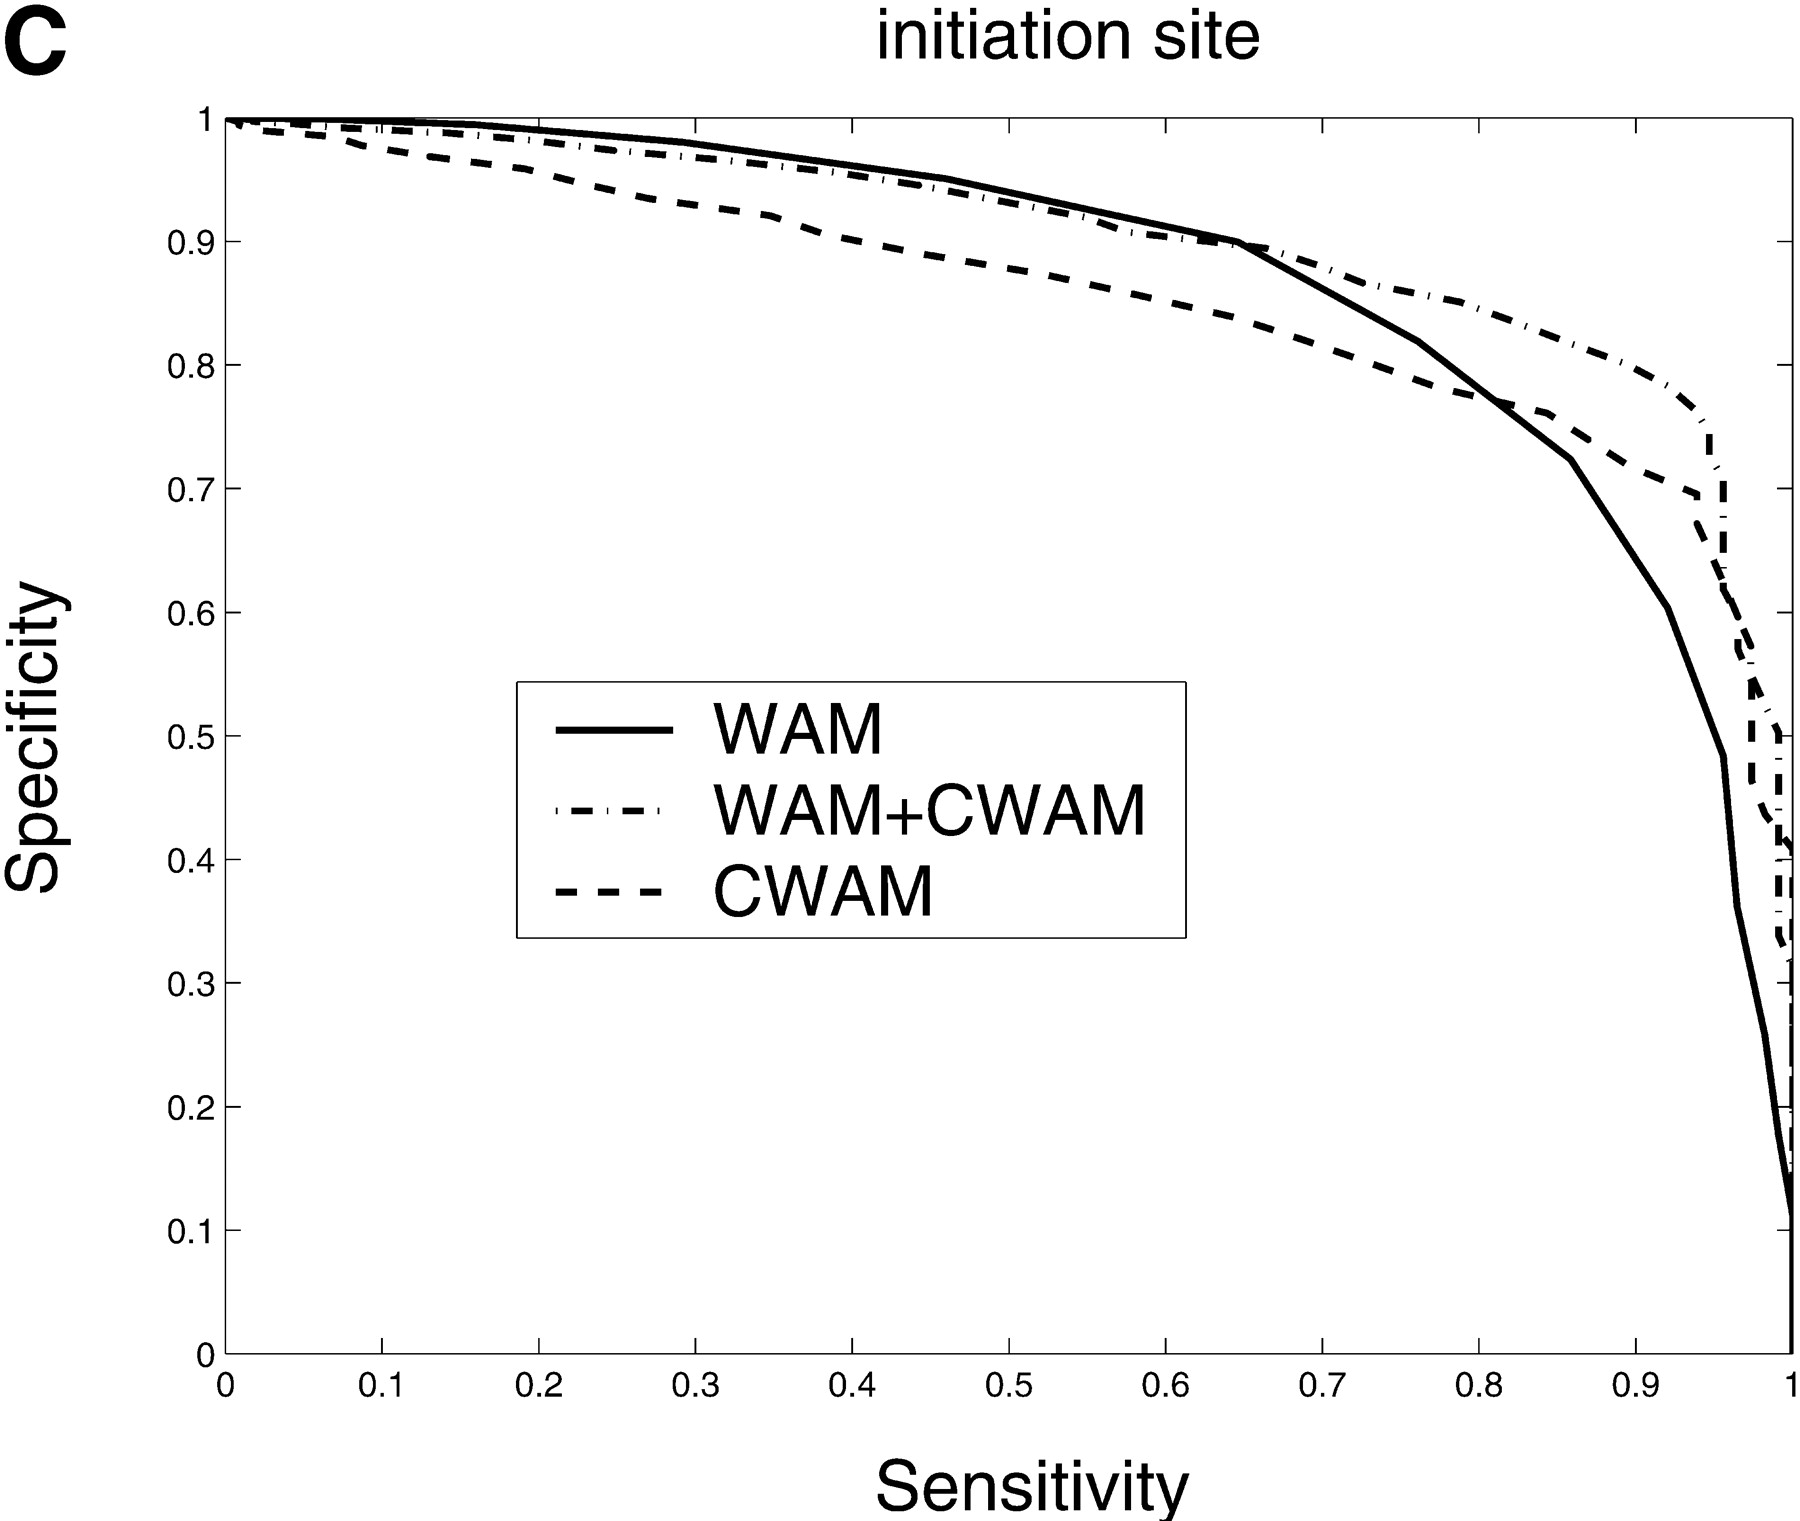
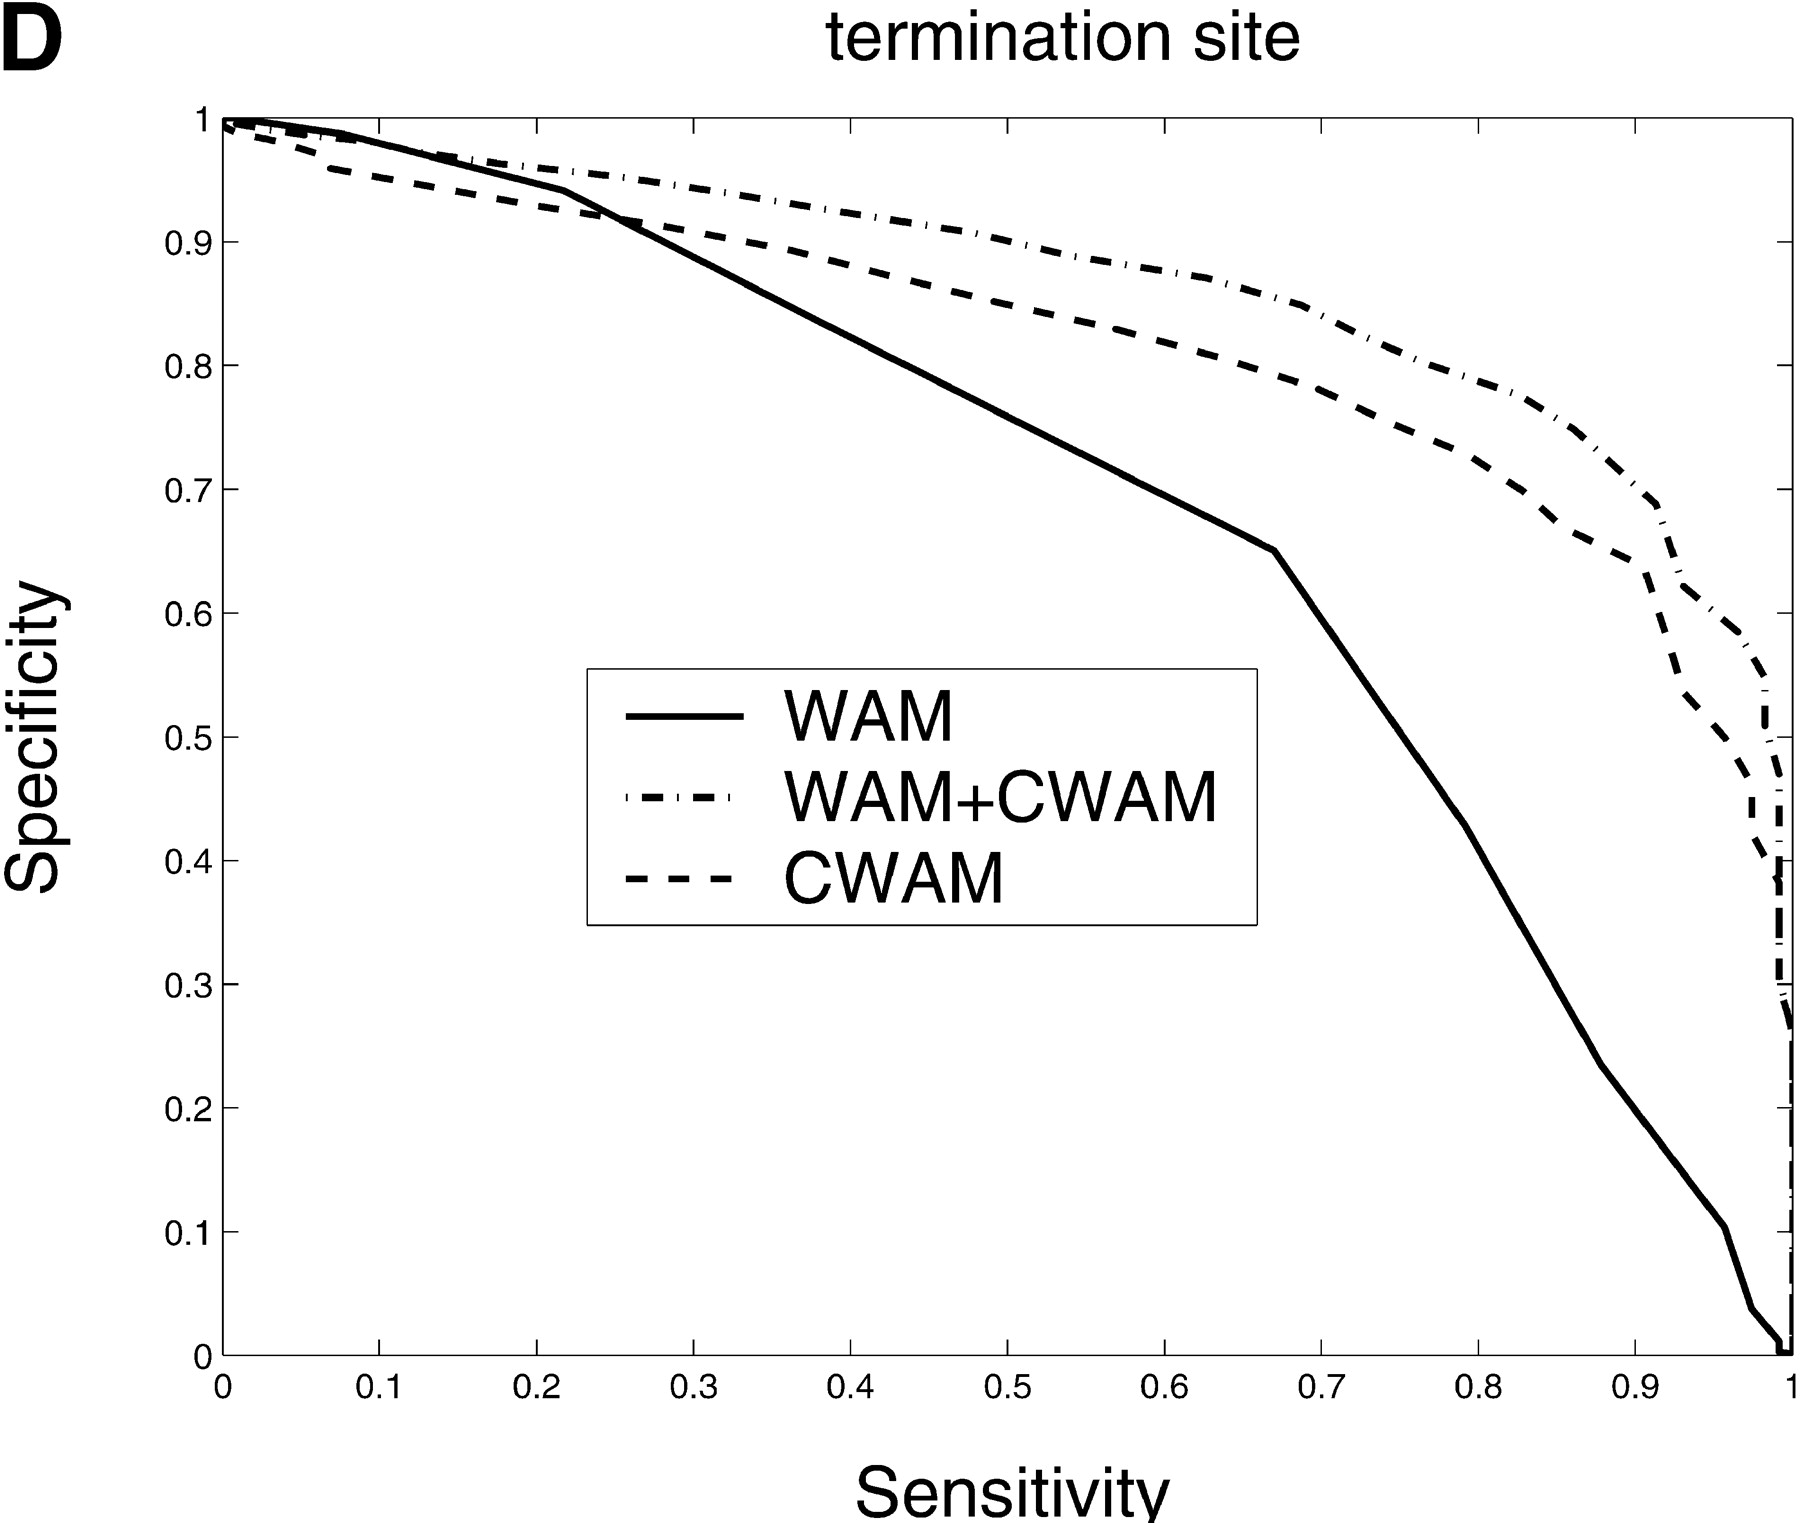
Comparison of the performance of CWAM, WAM, and WAM + CWAM models on detecting the splice sites and translational initiation and termination sites with an ROC analysis. The performance is evaluated by leave-one-out cross-validation, i.e., the model is trained on all but one sequence and then evaluated on the remaining sequence. Performance is finally averaged over all such possible partitions. (A) Donor site, the area under each ROC curve is WAM, 0.93; CWAM, 0.85; WAM + CWAM, 0.94. (B) Acceptor site, the area under each ROC curve is WAM, 0.95; CWAM, 0.84; WAM + CWAM, 0.96. (C) Translational initiation site, the area under each ROC curve is WAM, 0.87; CWAM, 0.85; WAM + CWAM, 0.90. (D) Translational termination site, the area under each ROC curve is WAM, 0.68; CWAM, 0.82; WAM + CWAM, 0.86.


