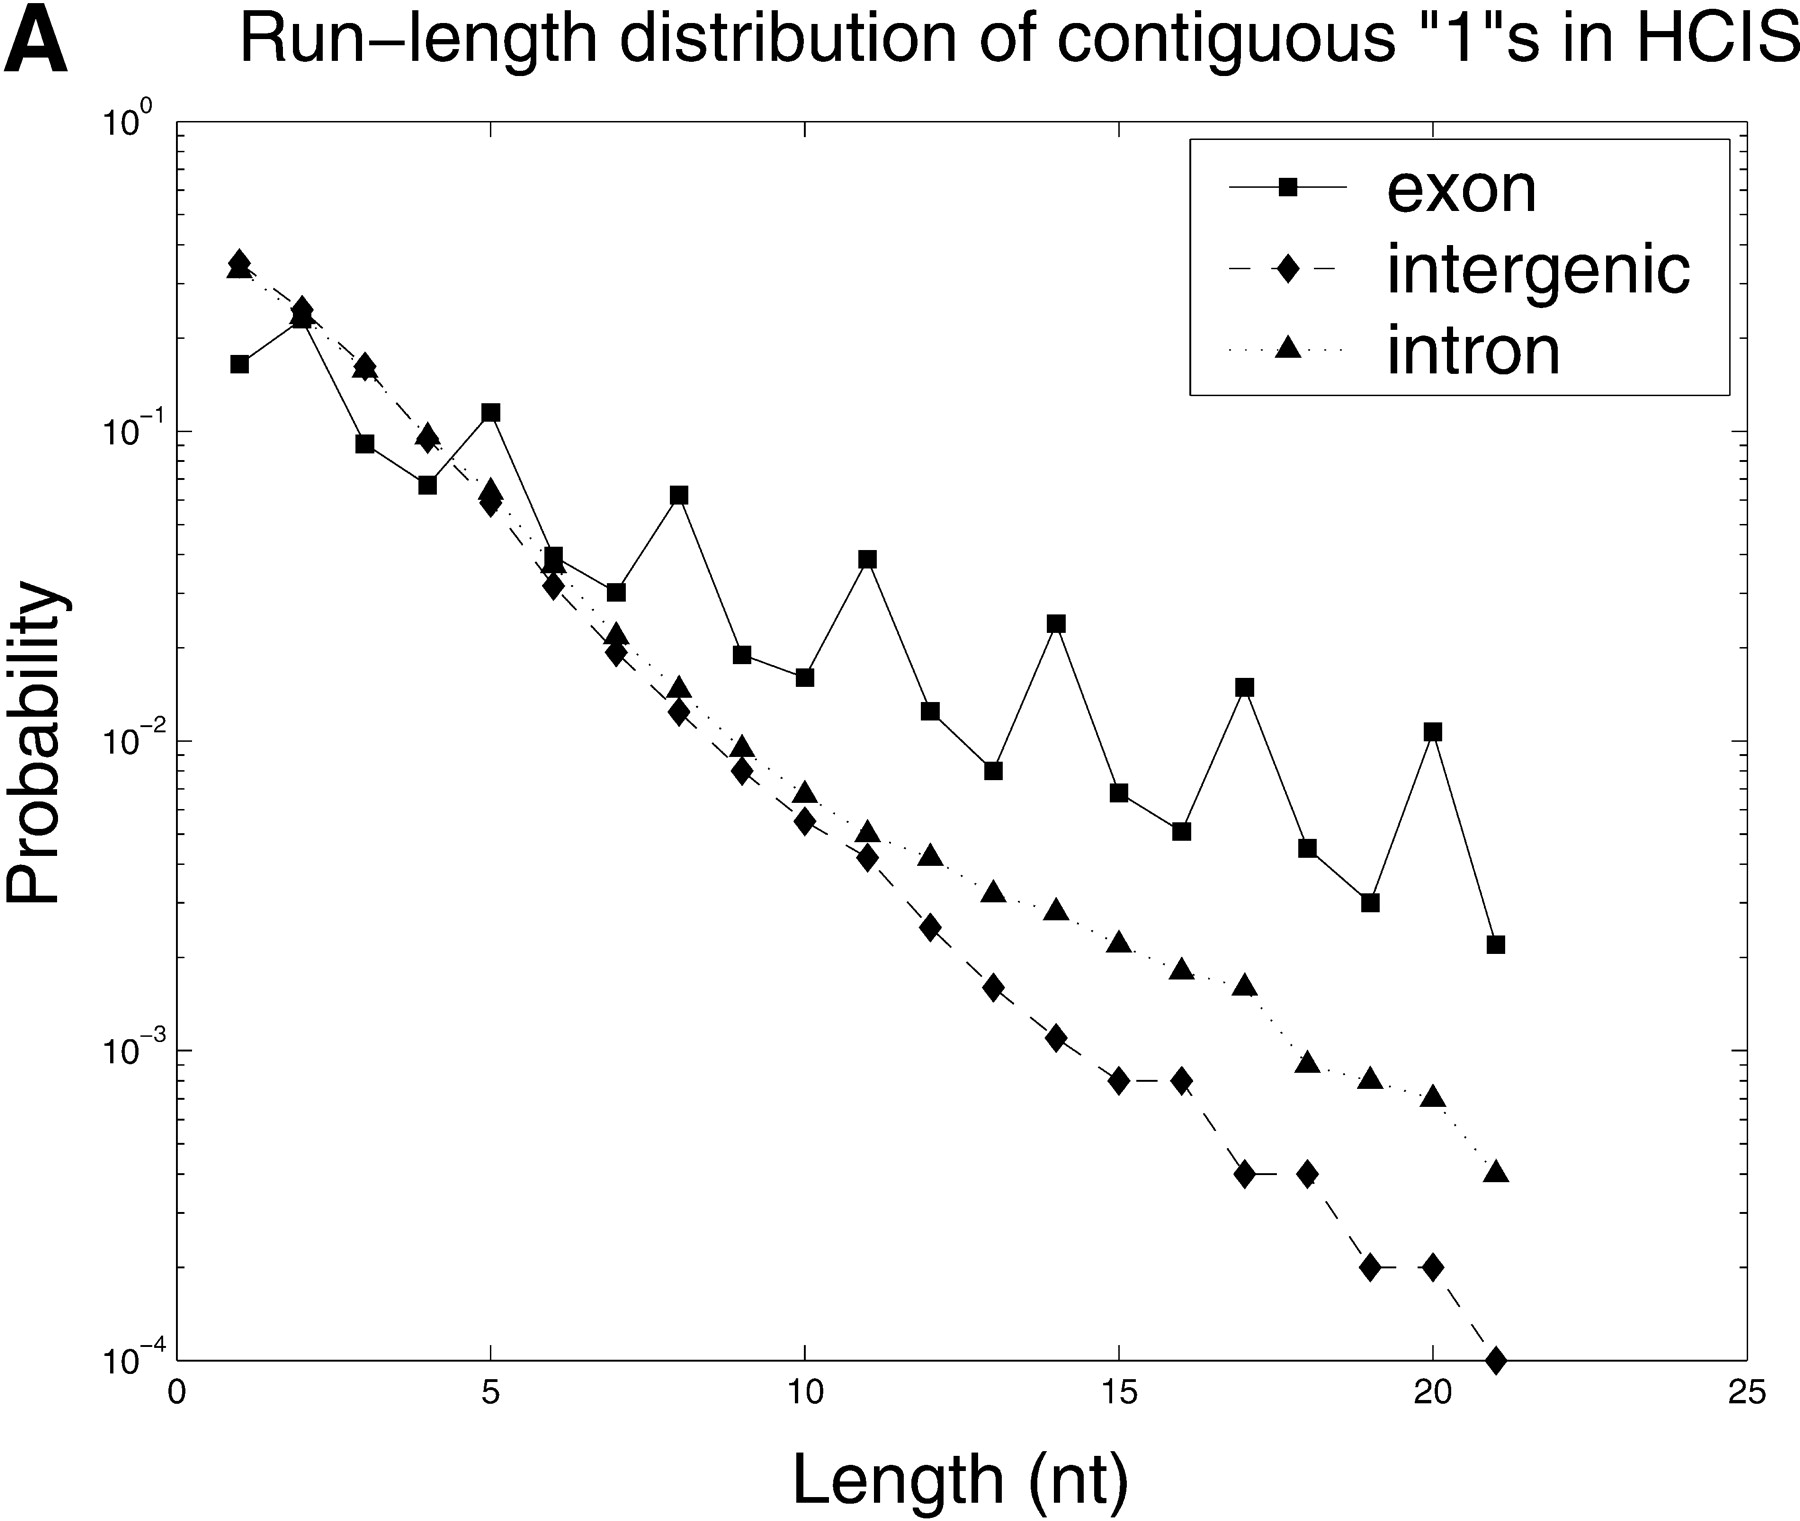
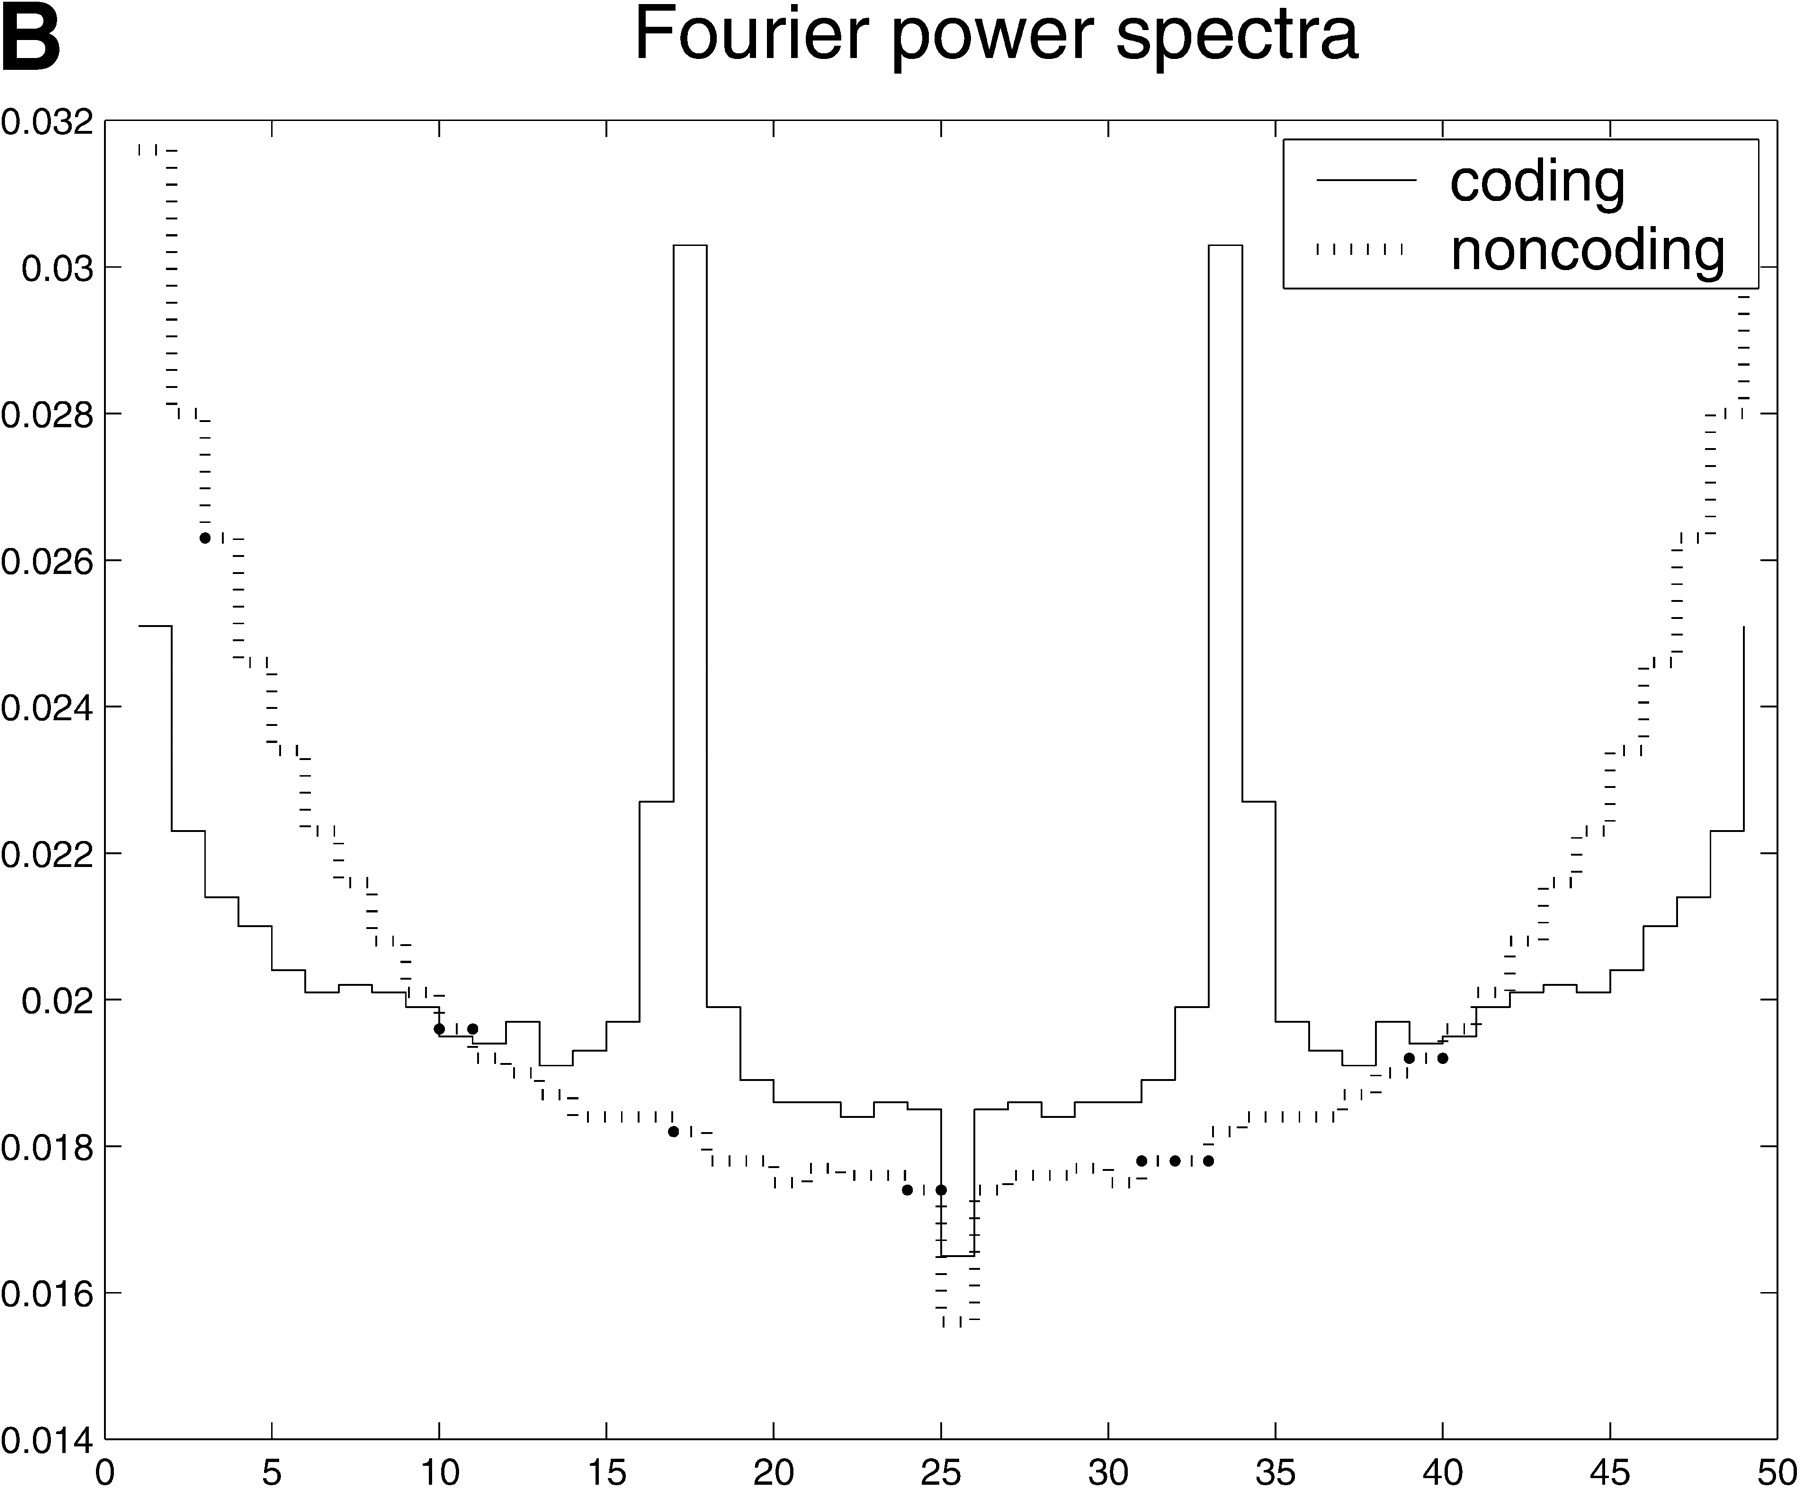
Human–Mouse Gene Identification by Comparative Evidence Integration and Evolutionary Analysis

(Downloading may take up to 30 seconds. If the slide opens in your browser, select File -> Save As to save it.)

Click on image to view larger version.

Figure 6Figure 6
Figure 6

(A) The run-length distributions of continuous 1s in HCIS in exon, intron, and intergenic sequences. (B) Fourier power spectrum of HCIS at coding (solid line) and noncoding (broken-dot line) regions. The peak corresponding to zero frequency has been omitted.

This Article

  1. Genome Res. 13: 1190-1202

Preprint Server