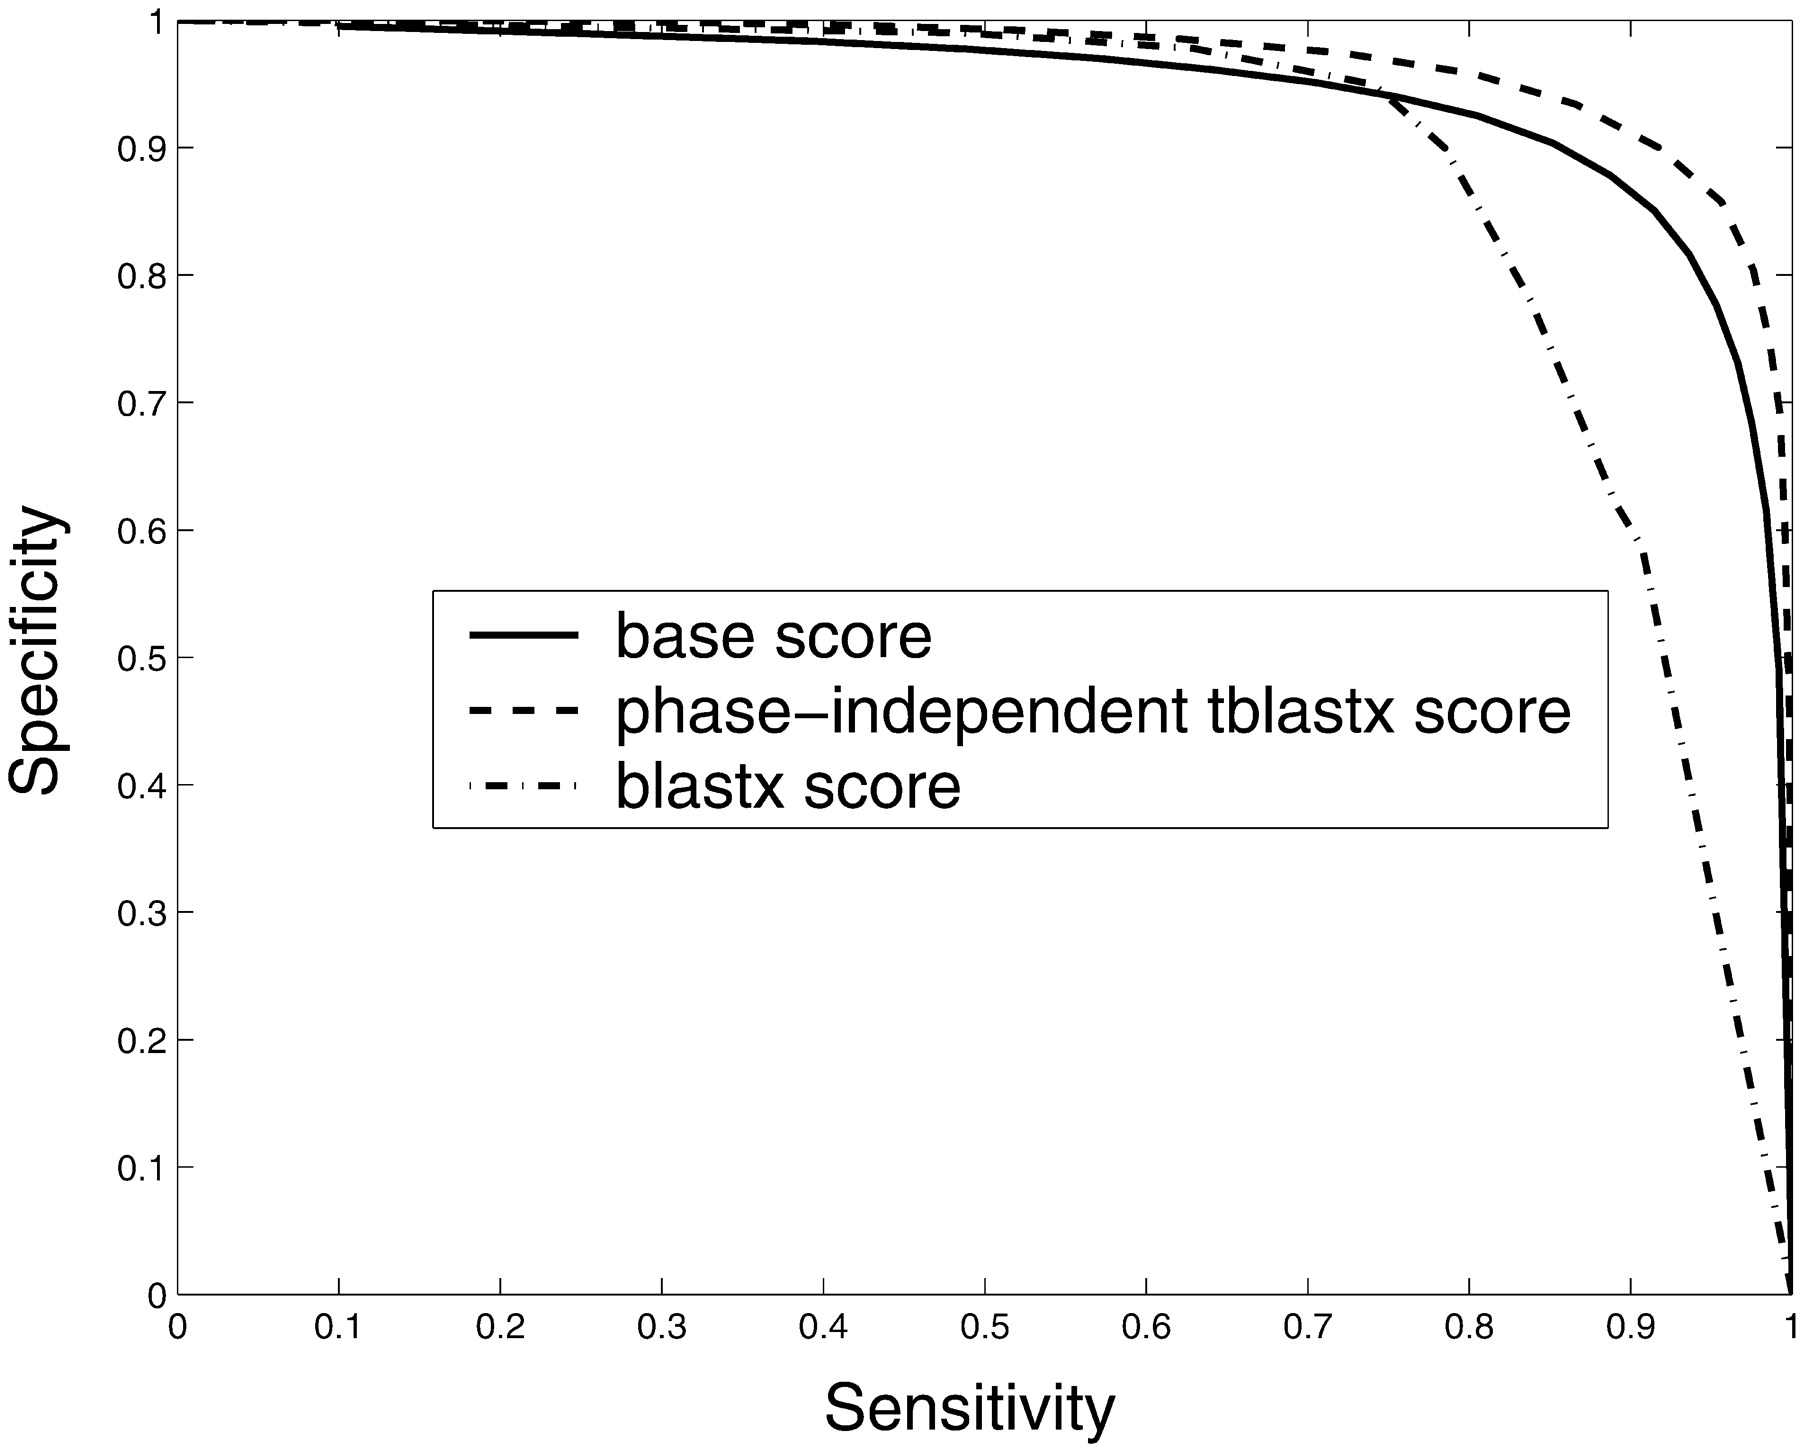
Human–Mouse Gene Identification by Comparative Evidence Integration and Evolutionary Analysis

(Downloading may take up to 30 seconds. If the slide opens in your browser, select File -> Save As to save it.)

Click on image to view larger version.

Figure 5
Figure 5

ROC analysis of ability of the base scores, phase-independent TBLASTX scores, and BLASTX scores to identify protein-encoding regions. Average accuracies of methods that use these scores are base scores, 0.93; phase-independent TBLASTX scores, 0.97; BLASTX scores, 0.89.

This Article

  1. Genome Res. 13: 1190-1202

Preprint Server