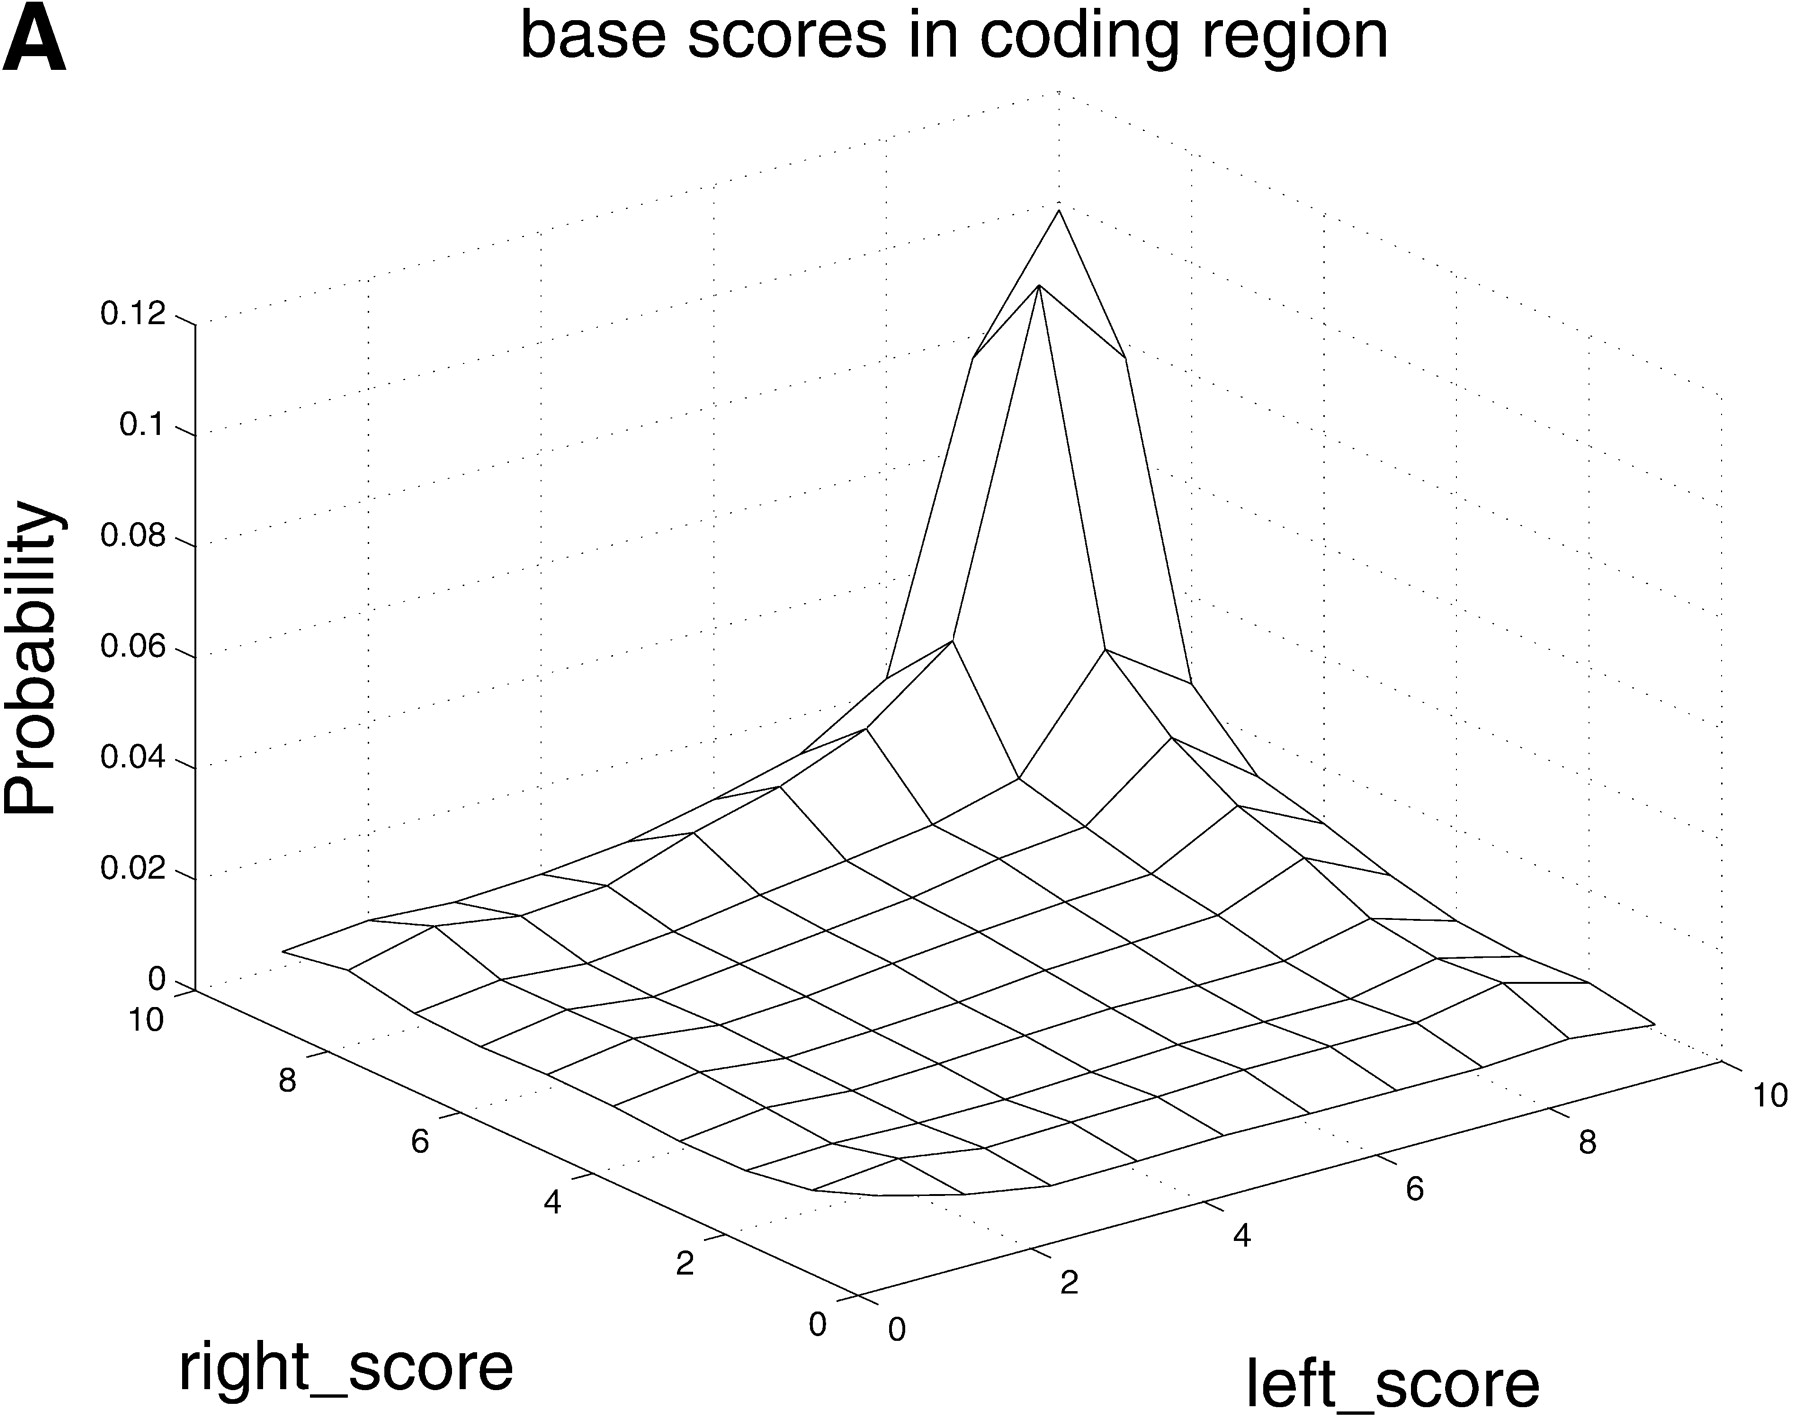
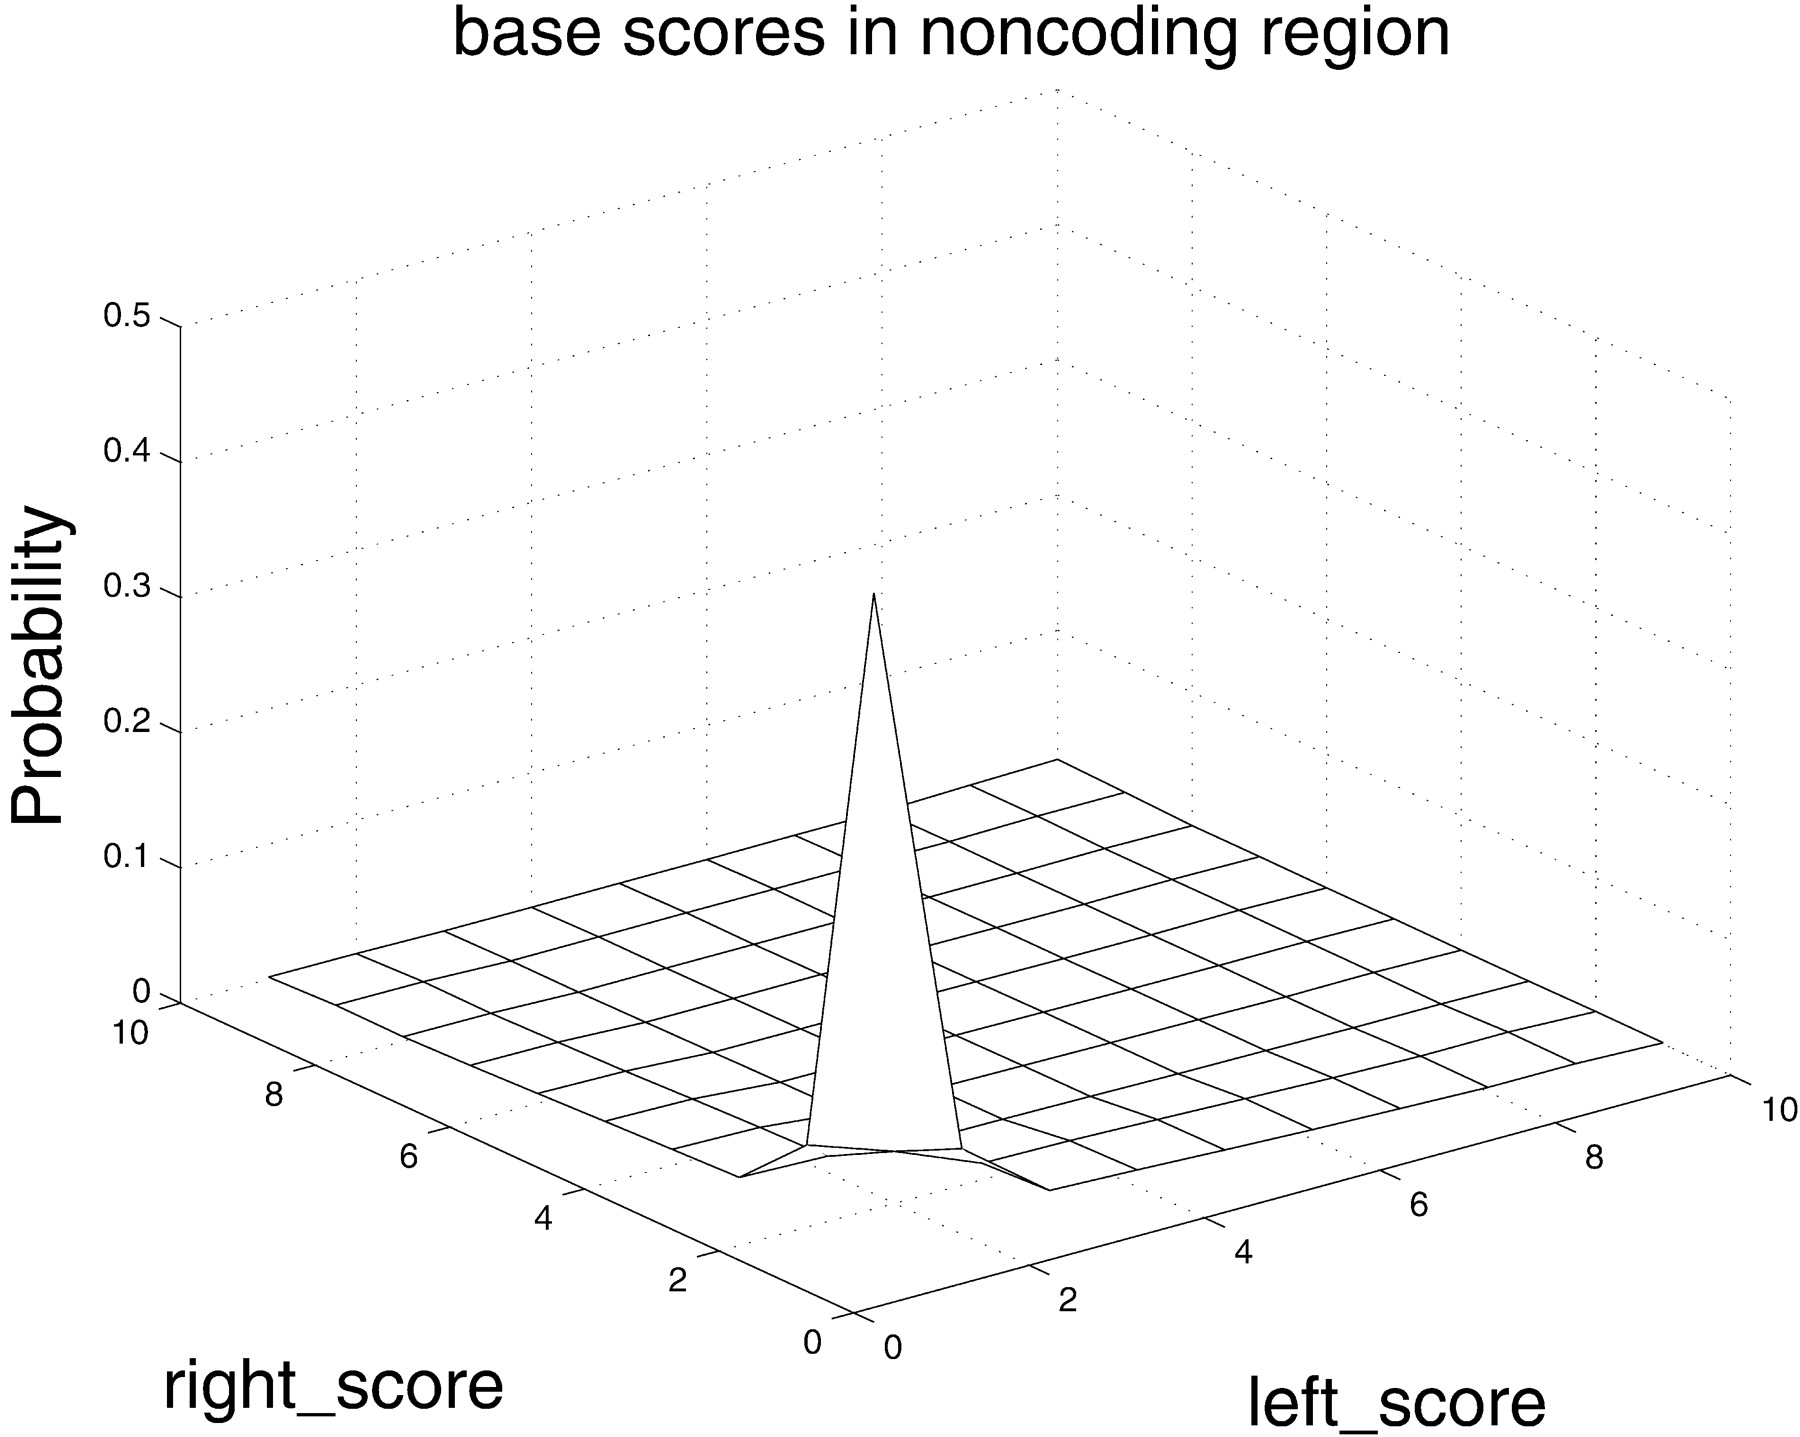
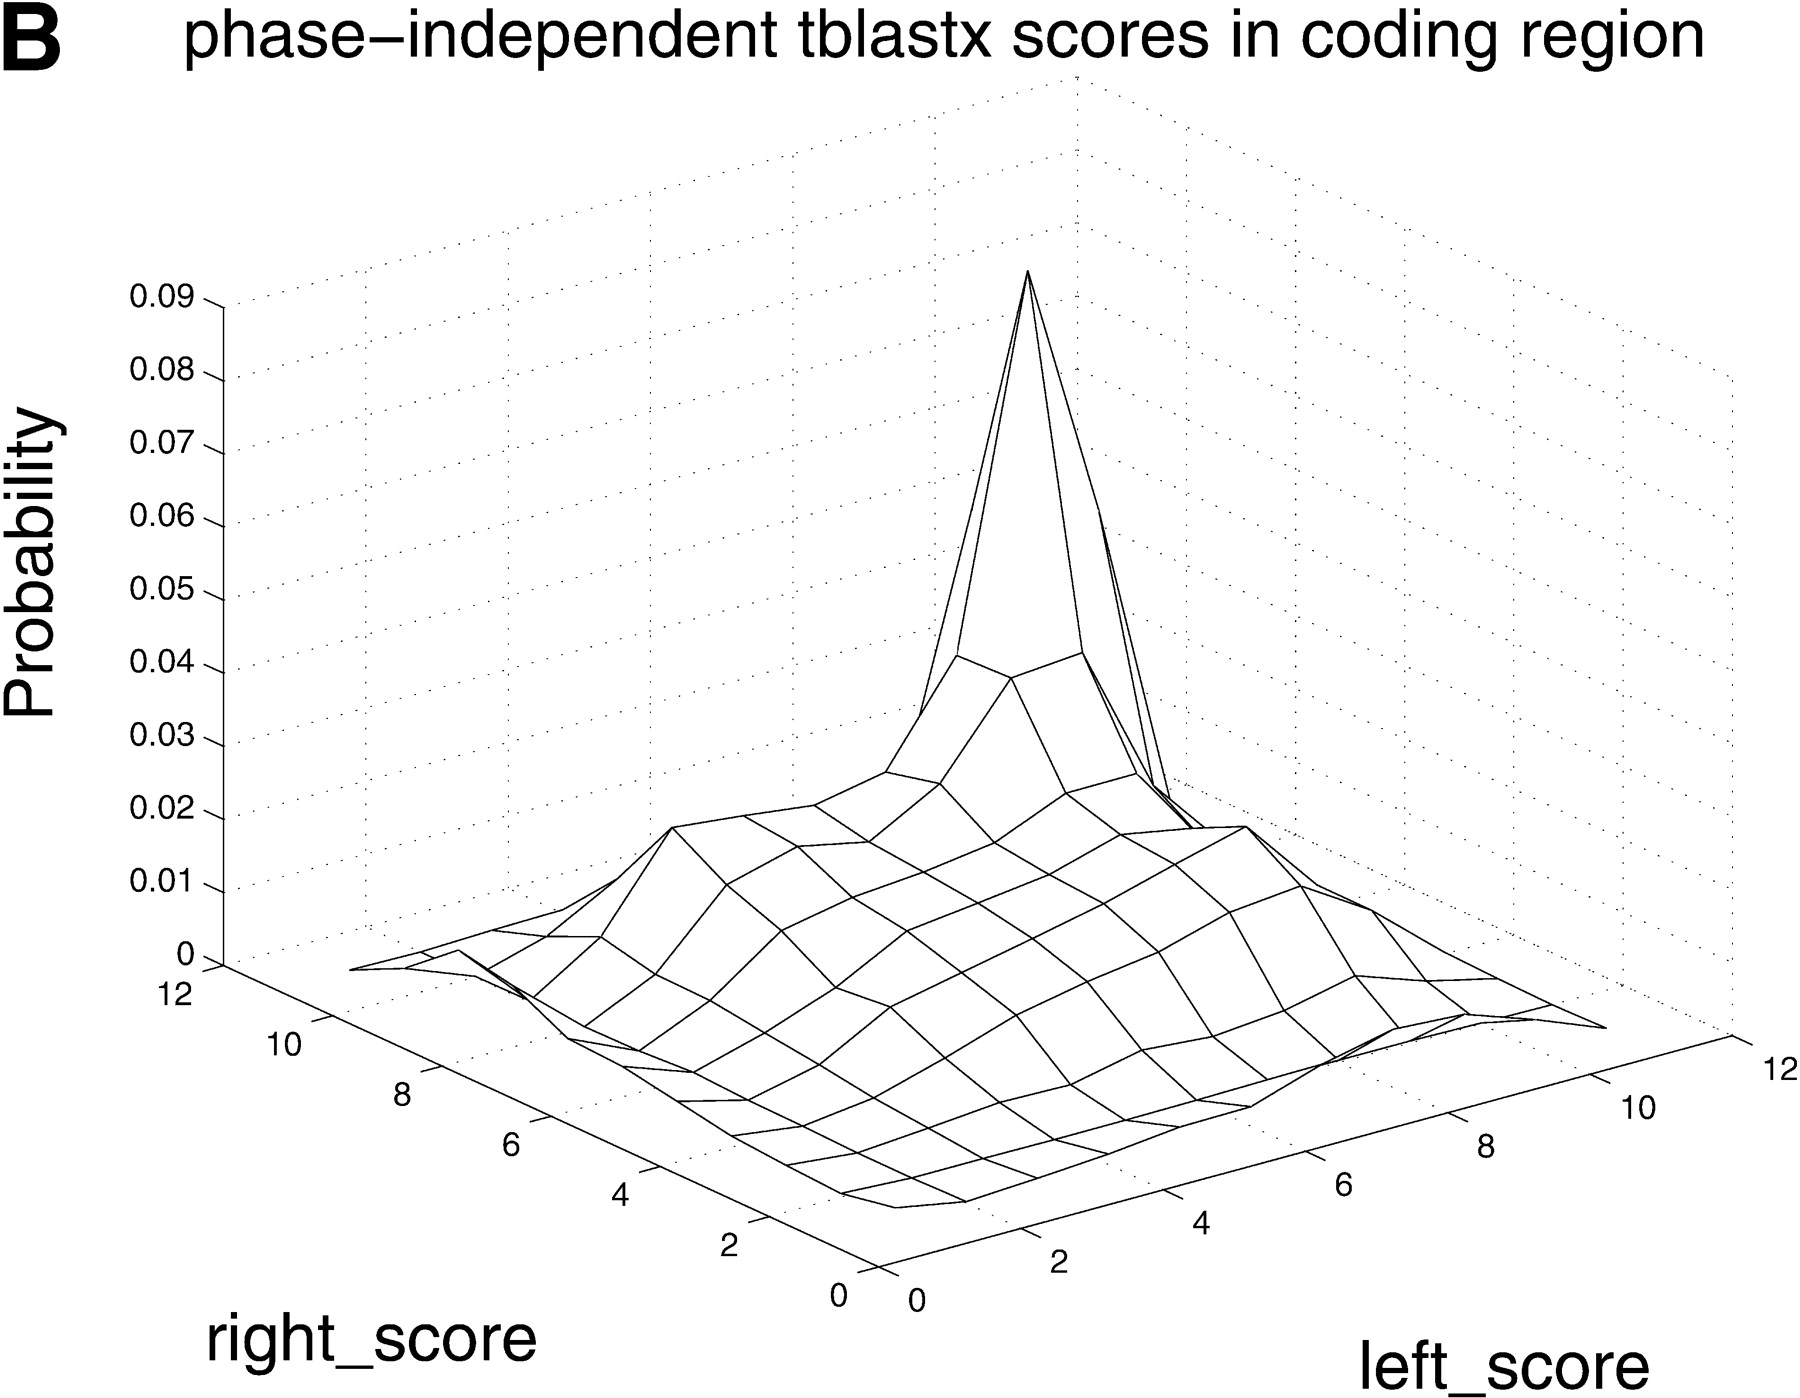
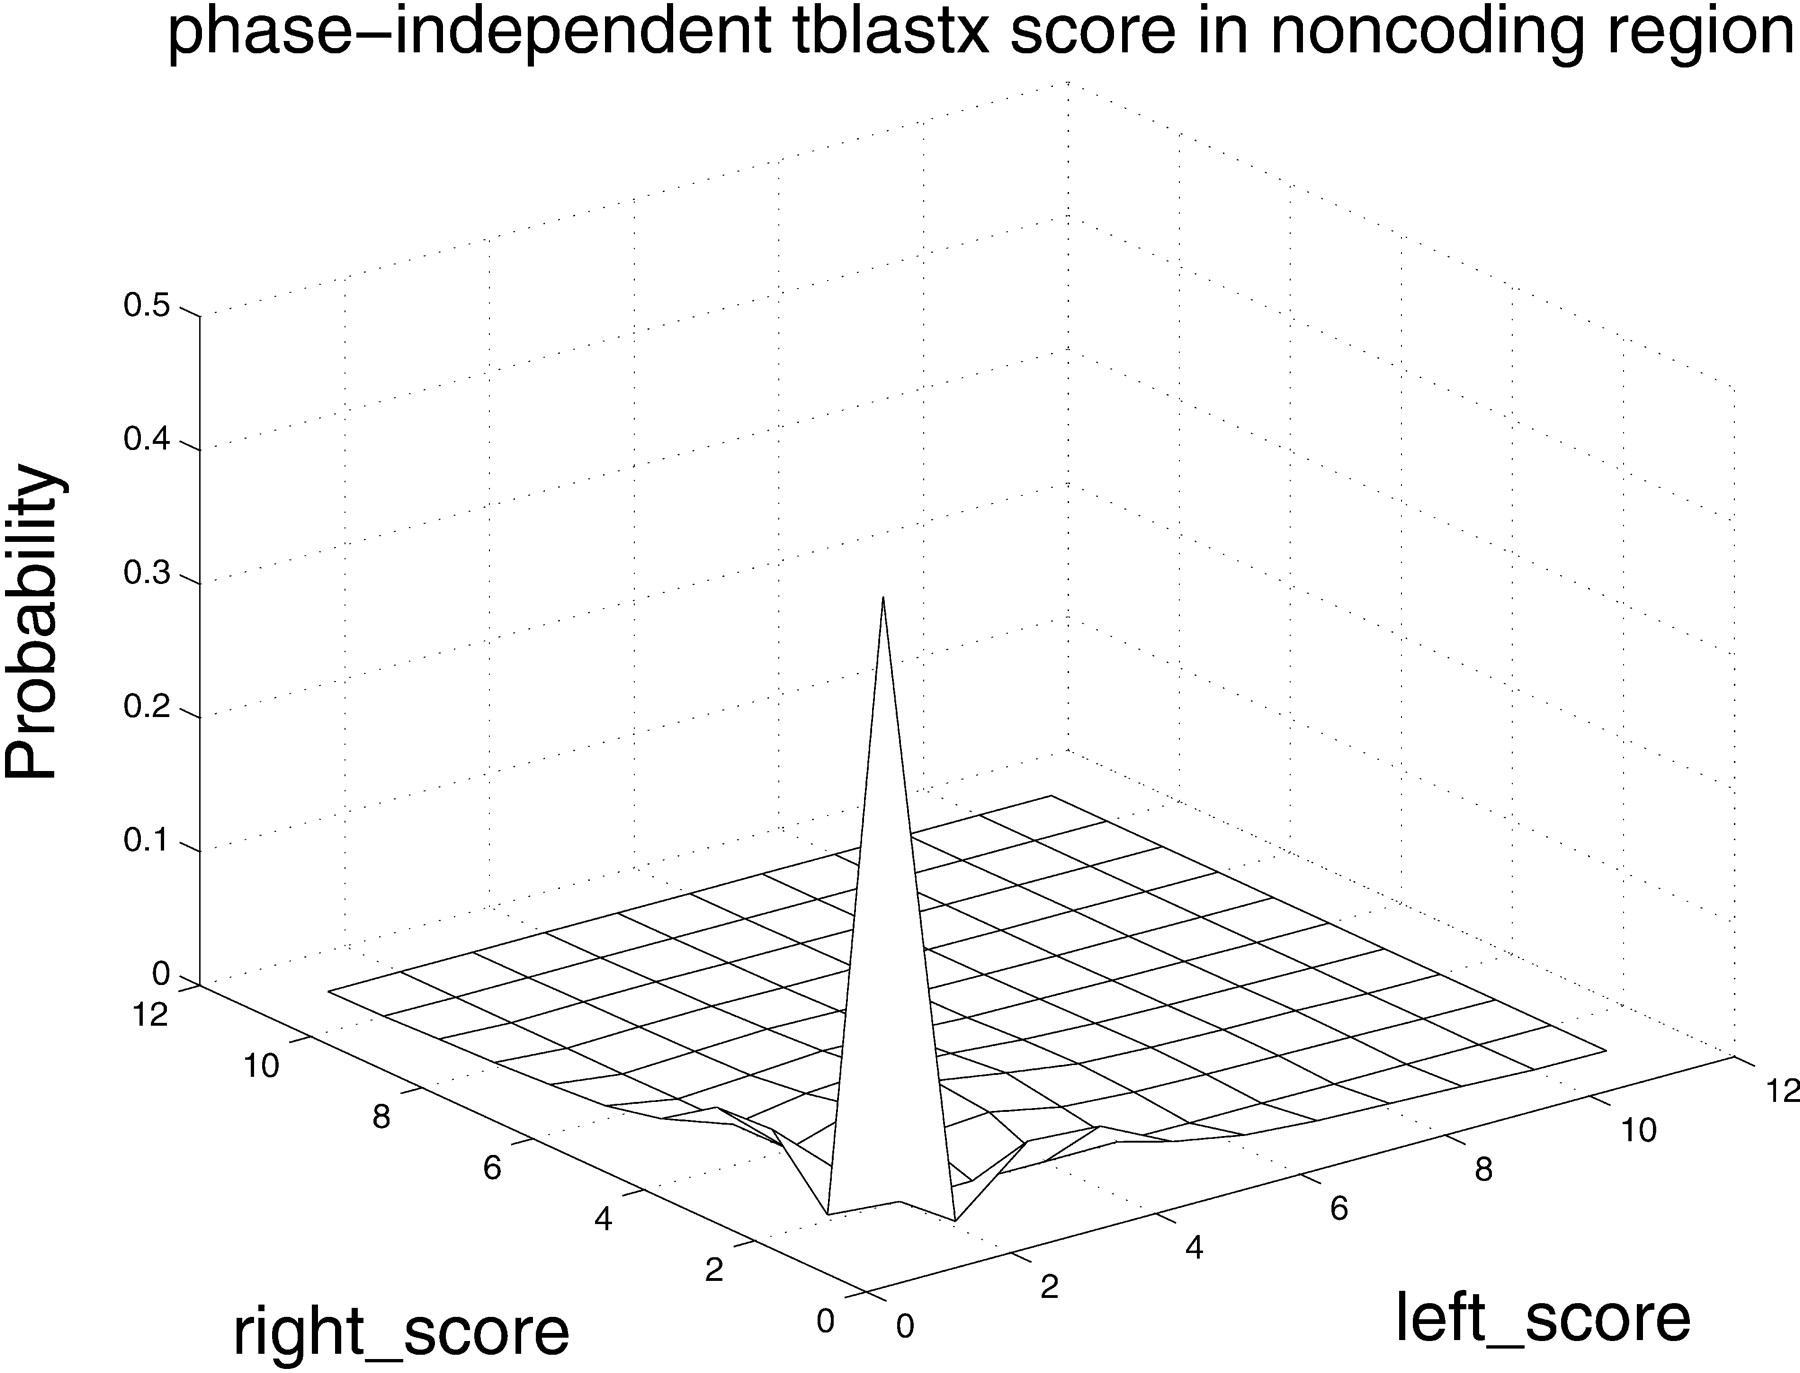
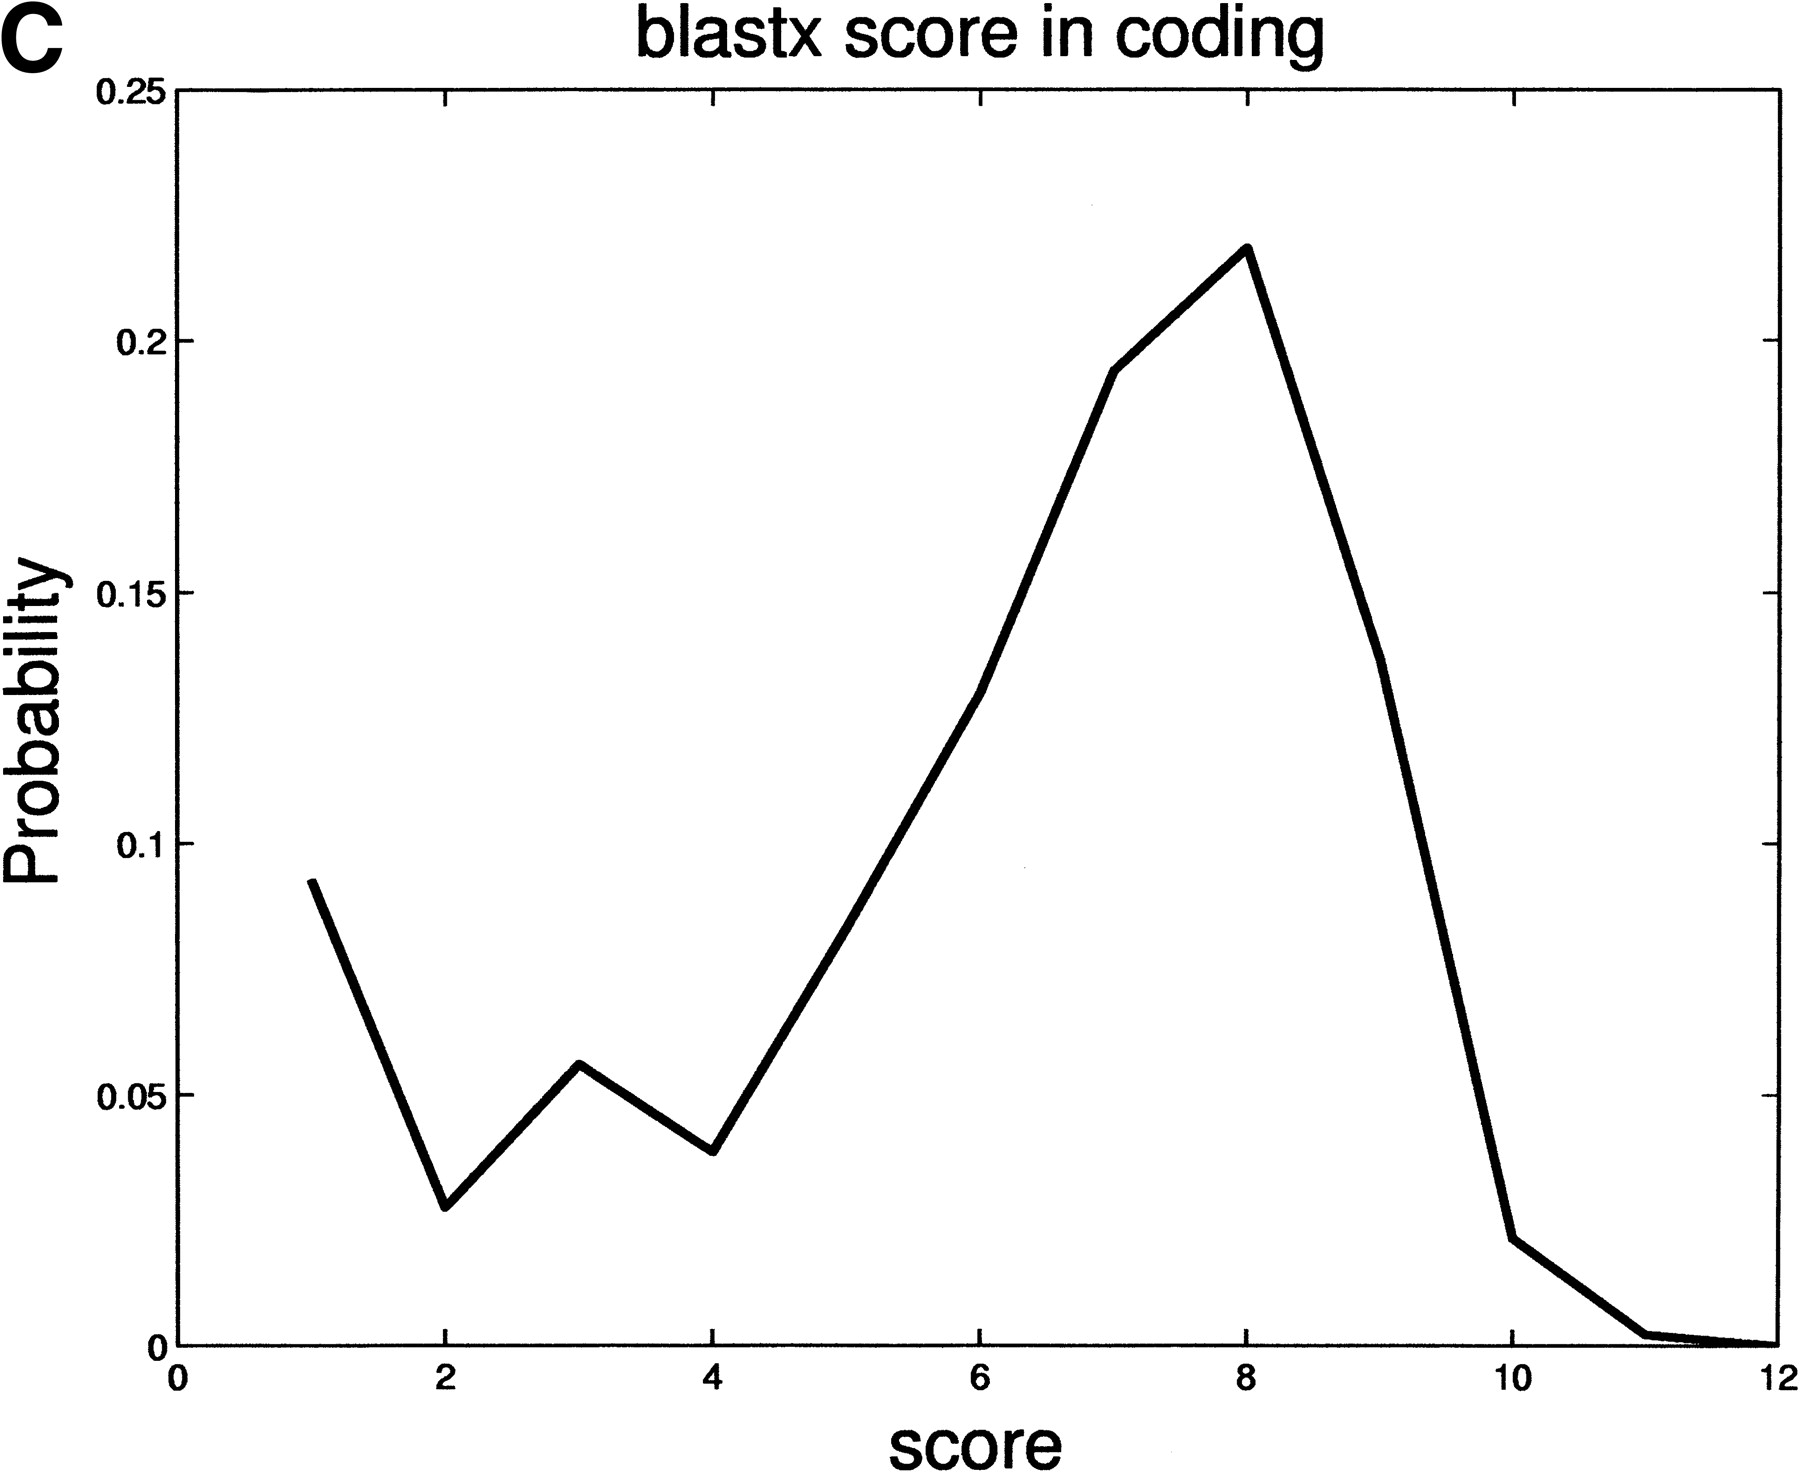
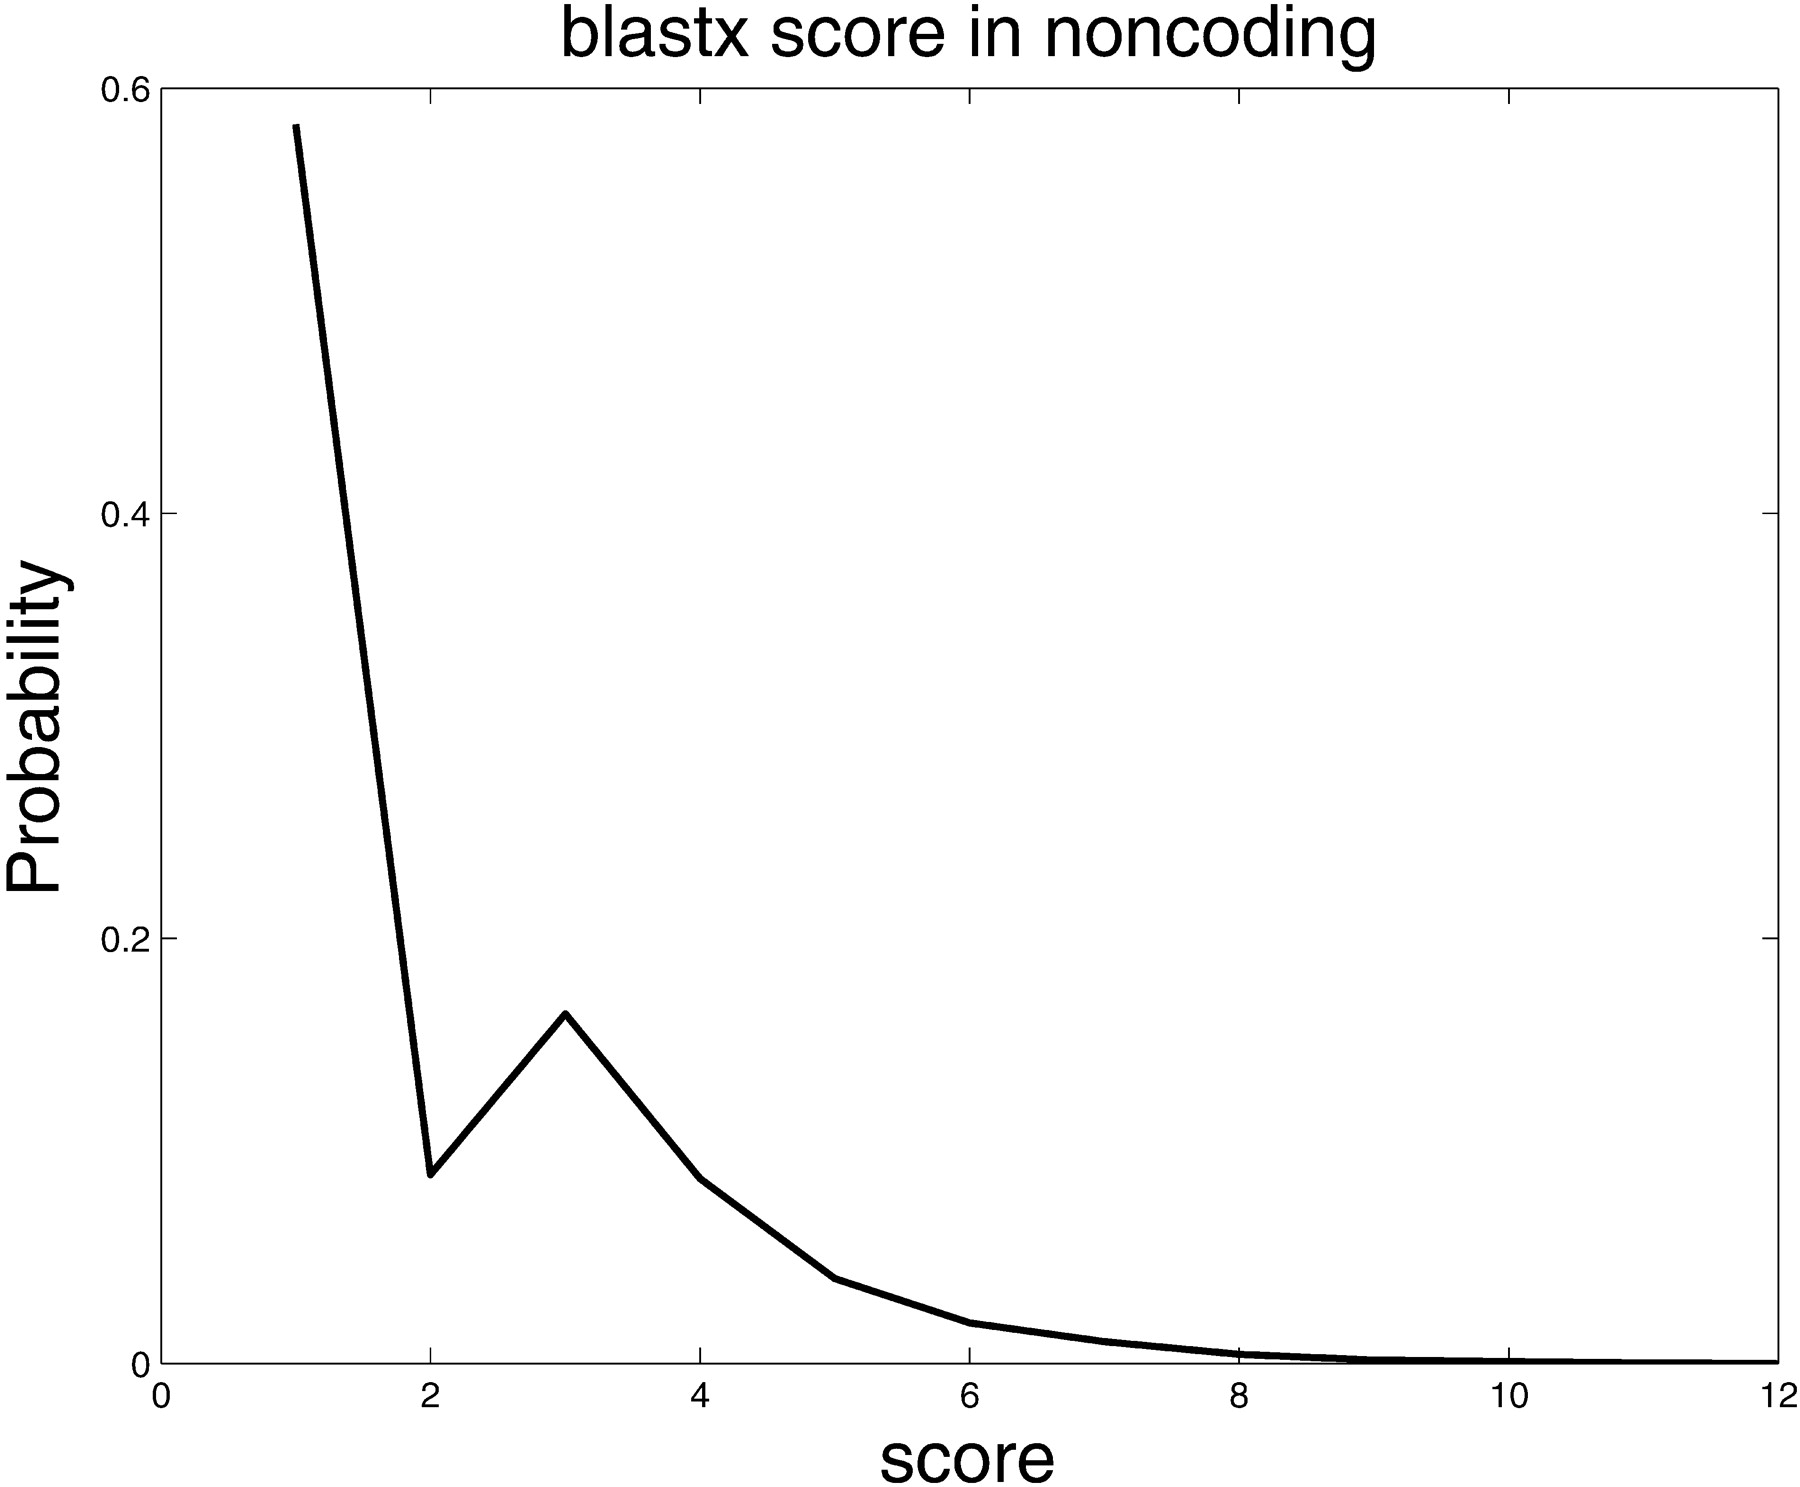
Human–Mouse Gene Identification by Comparative Evidence Integration and Evolutionary Analysis

(Downloading may take up to 30 seconds. If the slide opens in your browser, select File -> Save As to save it.)

Click on image to view larger version.

Figure 4Figure 4Figure 4Figure 4Figure 4Figure 4
Figure 4

Differences in distributions of comparative scores in coding and noncoding regions indicate their potential utility. Shown are (A) distributions of RBS and LBS Pr(RBS,LBS| coding) and Pr(RBS,LBS| noncoding); (B) distributions of phase-independent TBLASTX scores; and (C) distributions of BLASTX scores.

This Article

  1. Genome Res. 13: 1190-1202

Preprint Server