
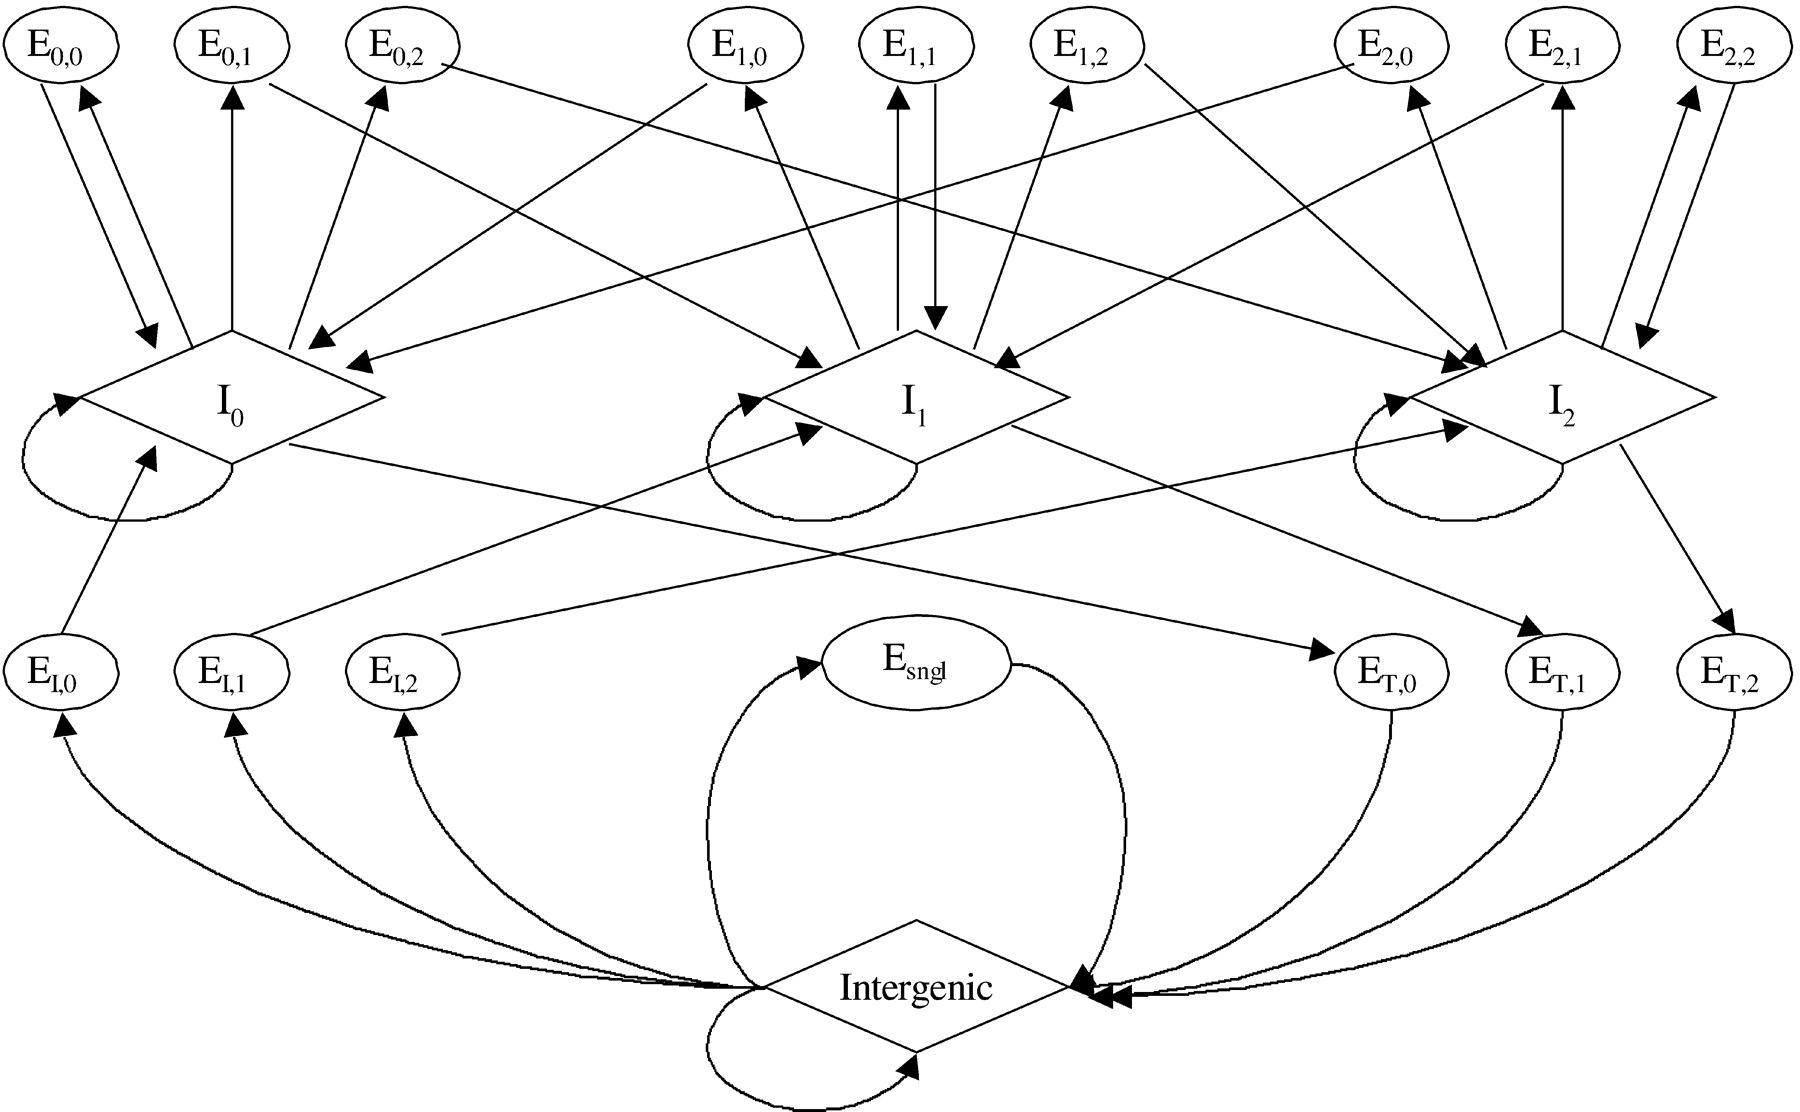
Generalized Hidden Markov Model of genomic sequence structure. Each oval or diamond represents a unit in the genomic sequence as follows: intergenic; El,k, k = 0,1,2, three states for initial exons; ET,k, k = 0,1,2, three states for terminal exons; Esngl, single exon genes; El,k, l = 0,1,2 k = 0,1,2, internal exons at reading frames l; Il,l = 0,1,2, introns at reading frames l. Splice signals (donor and acceptor) and translational initiation and termination signals are subcomponents of exons and are not shown in the model. Promoters, 5′ and 3′ UTRs, poly(A) signals, and the complementary strand are not modeled. The length distribution of each coding state is modeled explicitly.


