

Figure 2
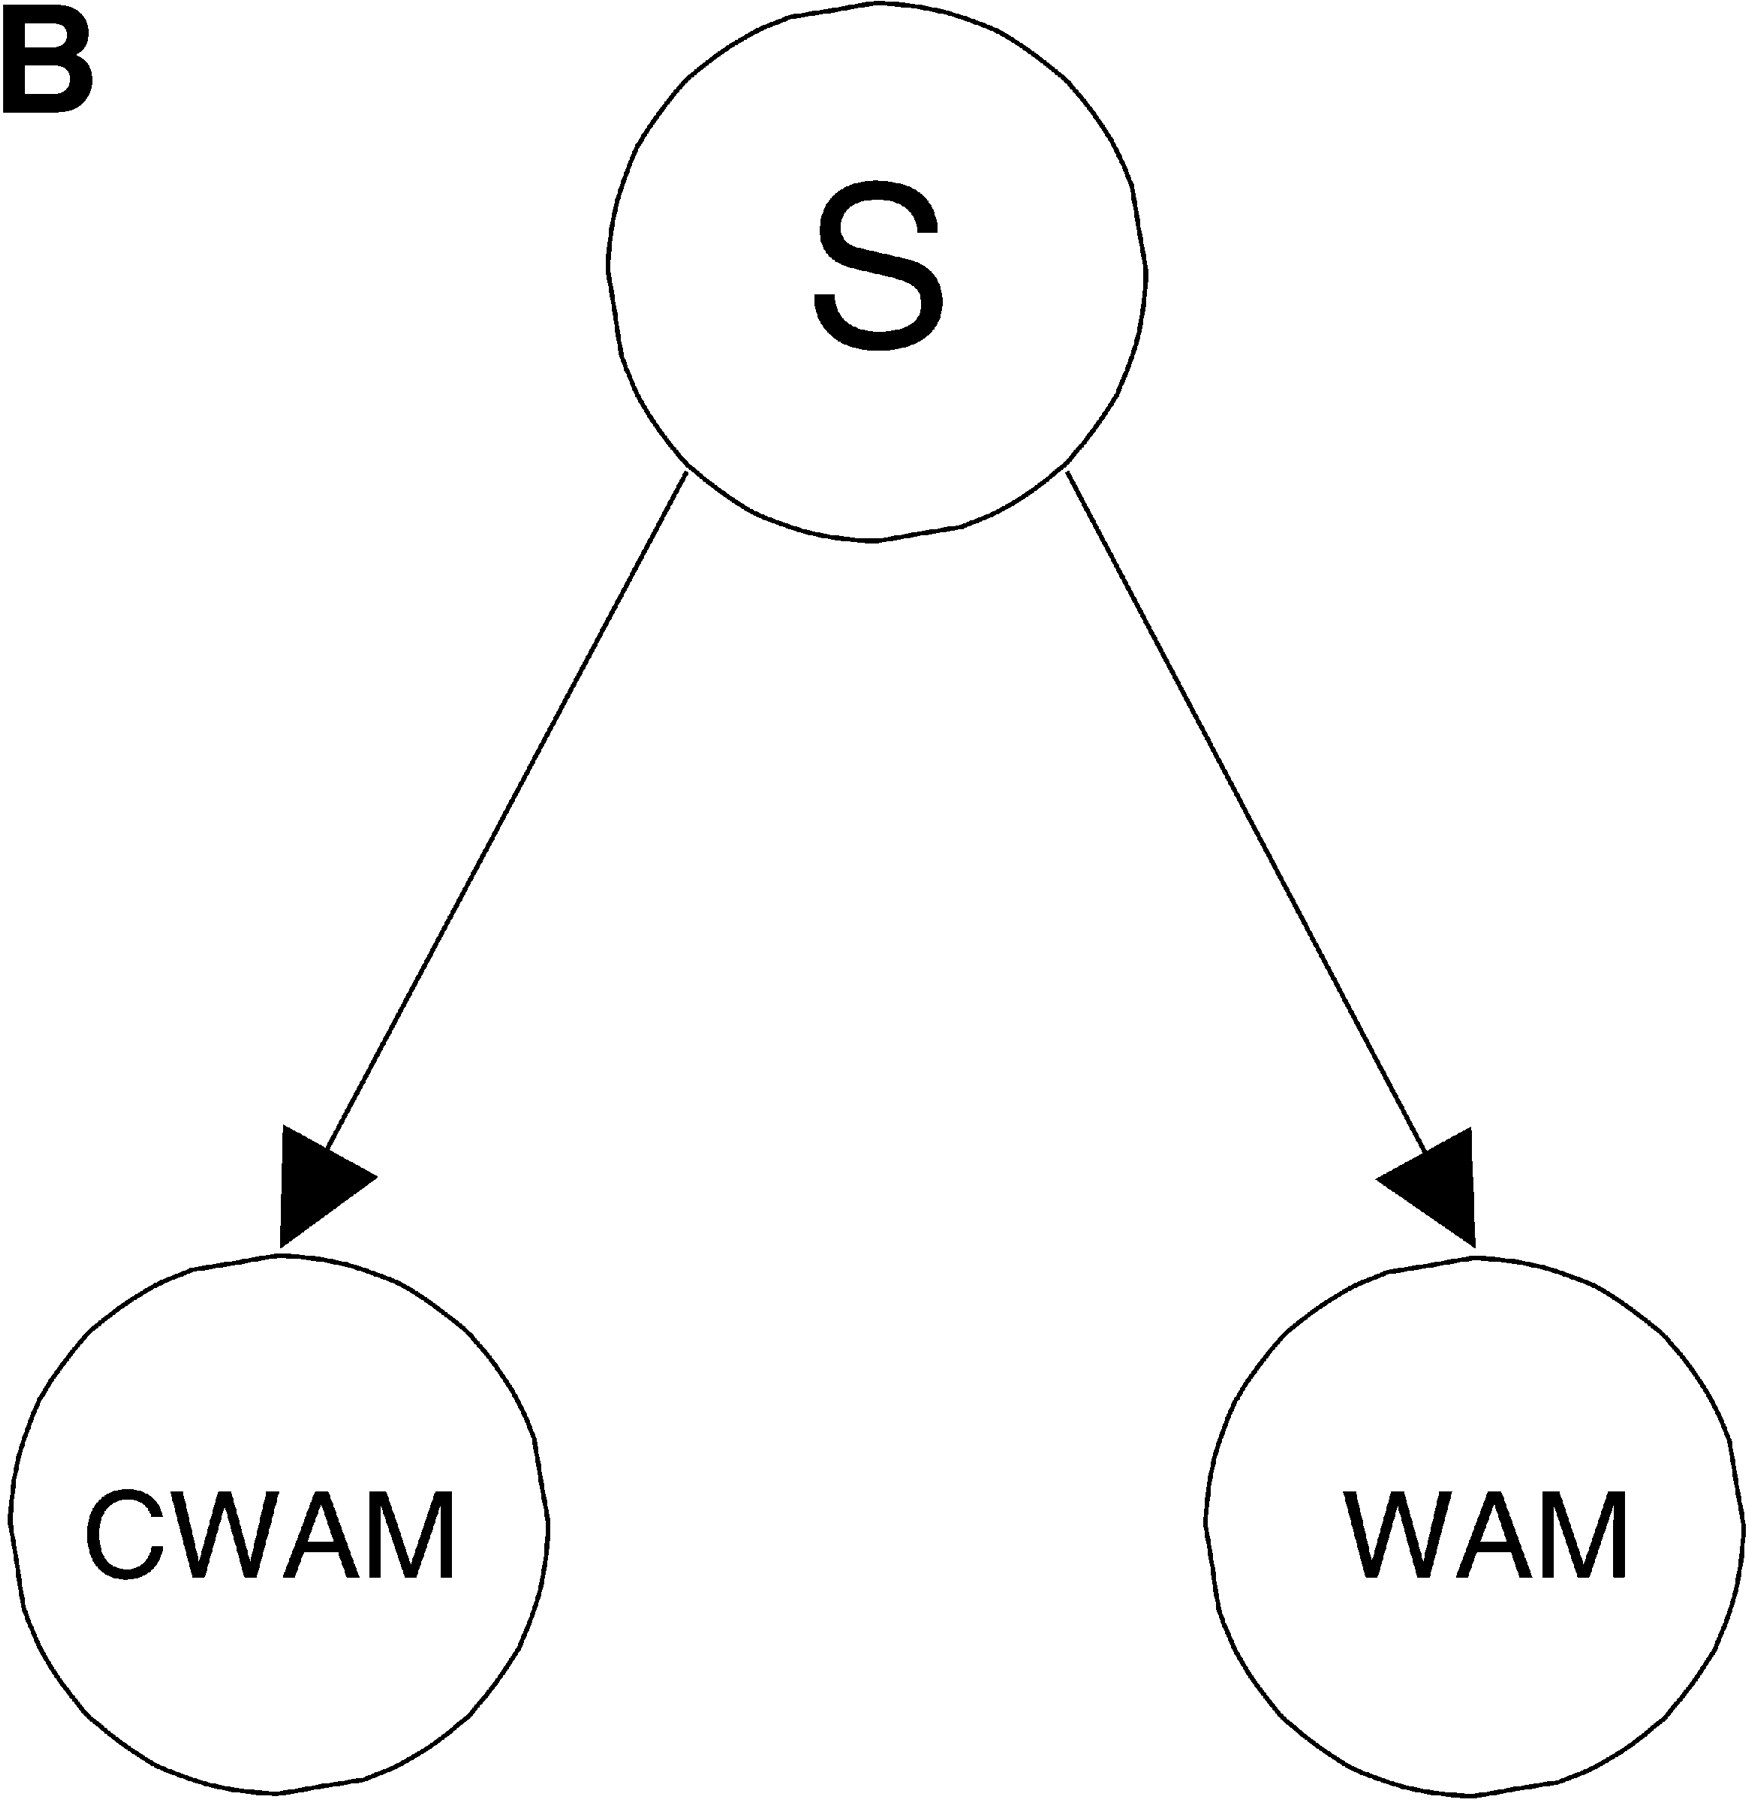
Integration of various features is done using either A full Bayes network model or B naive Bayes. LBS, RBS, and GS denote three pieces of evidence and S denotes the states in the genomic sequence. The evidence could be either comparative or traditional genomic evidence, represented by predictions made by GENSCAN. The genomic states include exons, introns, or intergenic regions. The distribution defined by the full Bayesian model is Pr(LBS,RBS,GS| S) and allows no further factorization, whereas the naive Bayes allows decomposition Pr(CWAM,WAM| S) = Pr(CWAM| S)Pr(WAM| S).


