
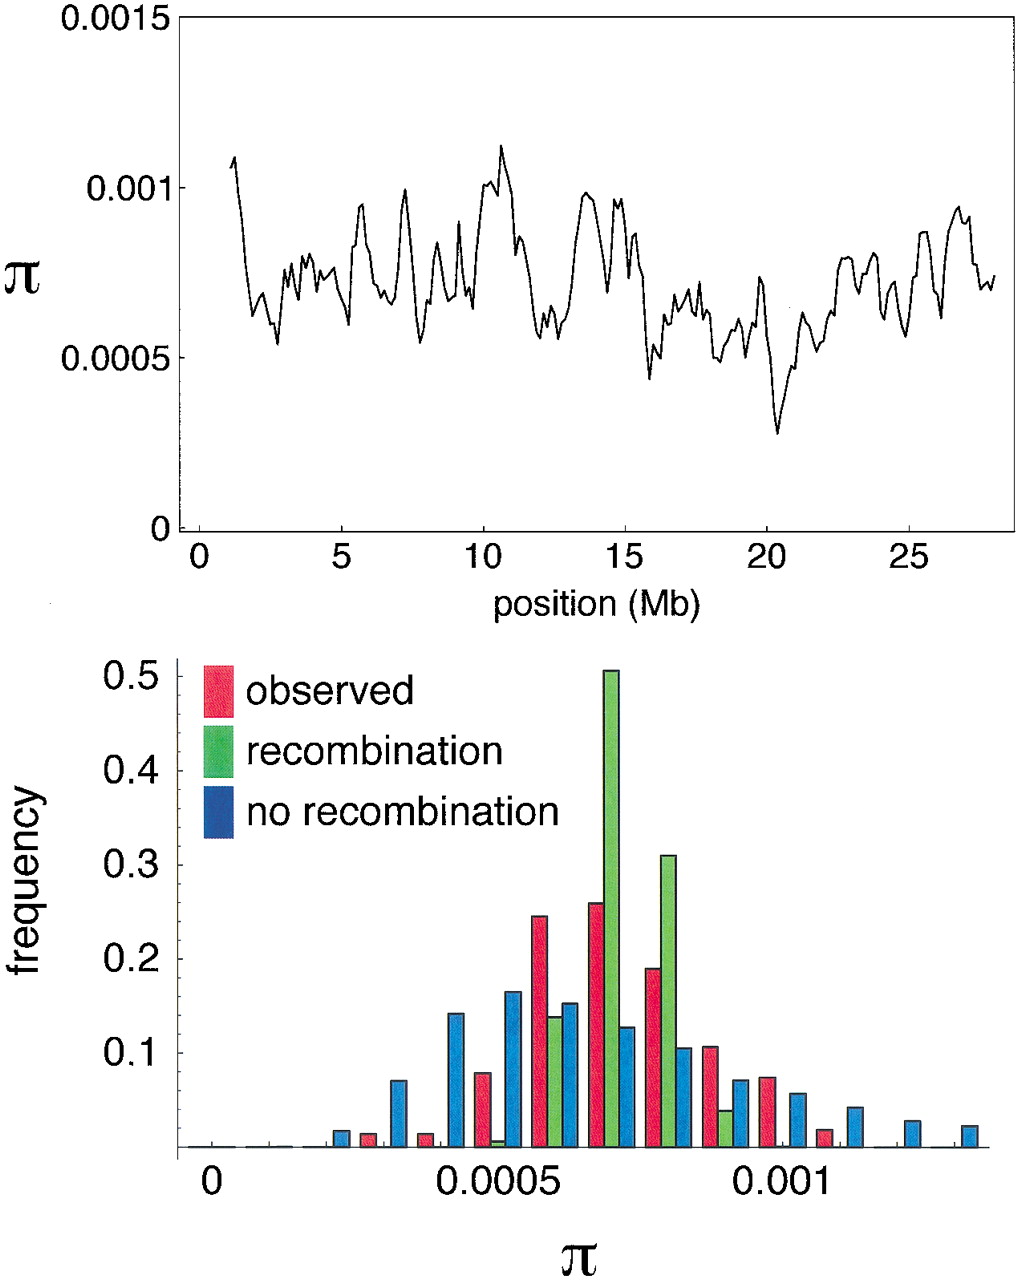
Figure 3
The upper plot shows a moving average of nucleotide diversity, using nonoverlapping windows of size 500 kb. The bottom panel shows a histogram of these (nonindependent) windows, together with two sets of 5000 independently simulated windows. Both sets used the estimated θ = 7.2 × 10⁻⁴, but one used the estimated ρ = 4.2 × 10⁻⁴ whereas the other assumed no recombination within windows.


