
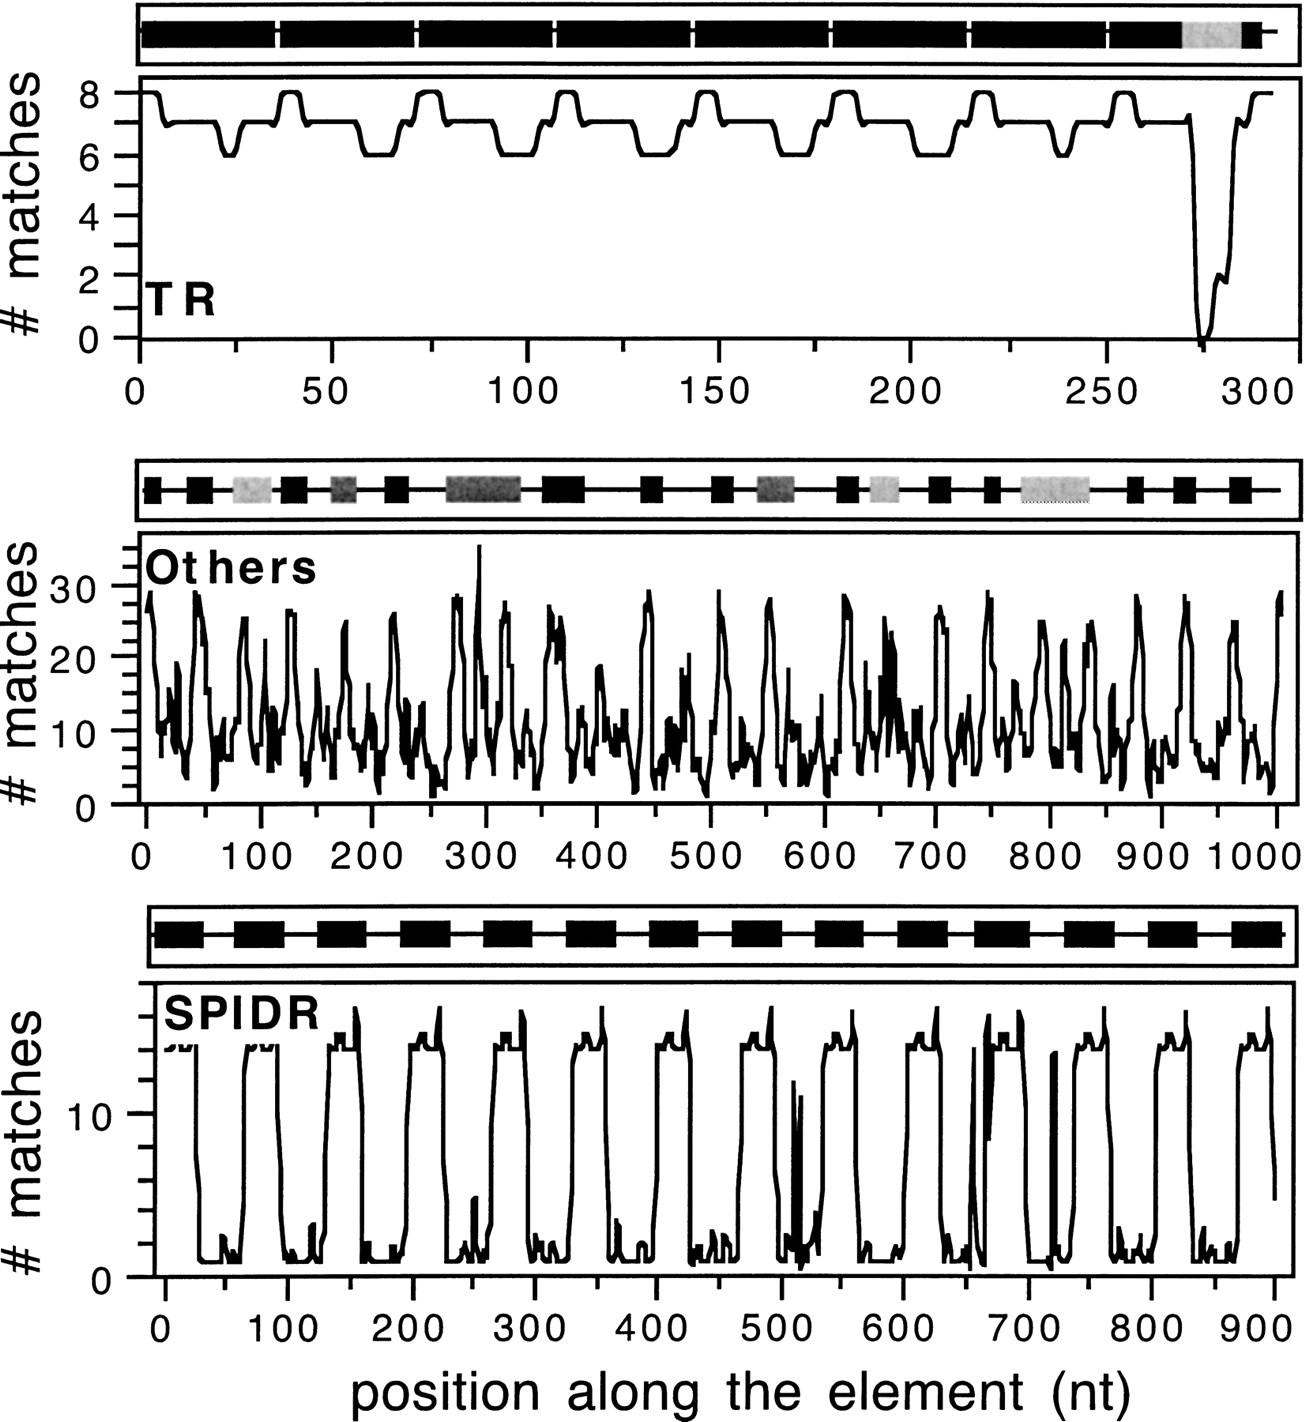
Figure 2
Typical profiles of TRs (top panel), SPIDRs (bottom), and “others” (middle). The curves indicate the pattern matching of a 10-nt oligonucleotide (accepting up to two mismatches) in the remaining sequence. The black and gray boxes indicate the highly similar and degenerate repeats, respectively.


