
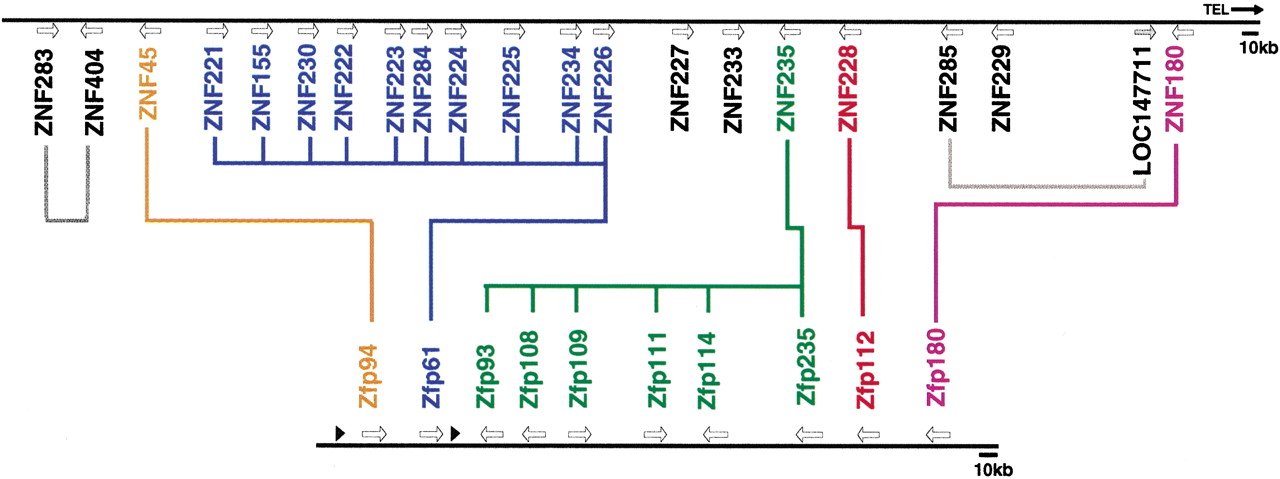
Organization of predicted orthologs and paralogs in the human and mouse maps. The 700-kb region encompassing the human ZNF gene family is represented at top, with the physical map of the related 300-kb Mmu7 ZNF gene family illustrated below it. The gene names are color-coded to highlight evolutionary relationships within and between maps, according to data presented in Fig. 4; Group I is blue, Group II is red, Group III is orange, Group IV is green, and Group V is purple. Colored lines connecting genes in the two families indicate putative pairs of orthologs, or sets where a single gene in one species belongs to a clade with an expanded group of multiple genes in the other species. The relationships of the human genes in black are not as well resolved (taking into account parsimony and ML results and high divergence), and therefore they are not connected on this diagram except for two closely related pairs of duplicates indicated by gray lines. Arrows indicate the approximate positions of genes; the two black triangles represent two gene fragments (an isolated KRAB-A box and a segment of DNA containing several degenerate fingers) as detailed in Fig. 1.


