
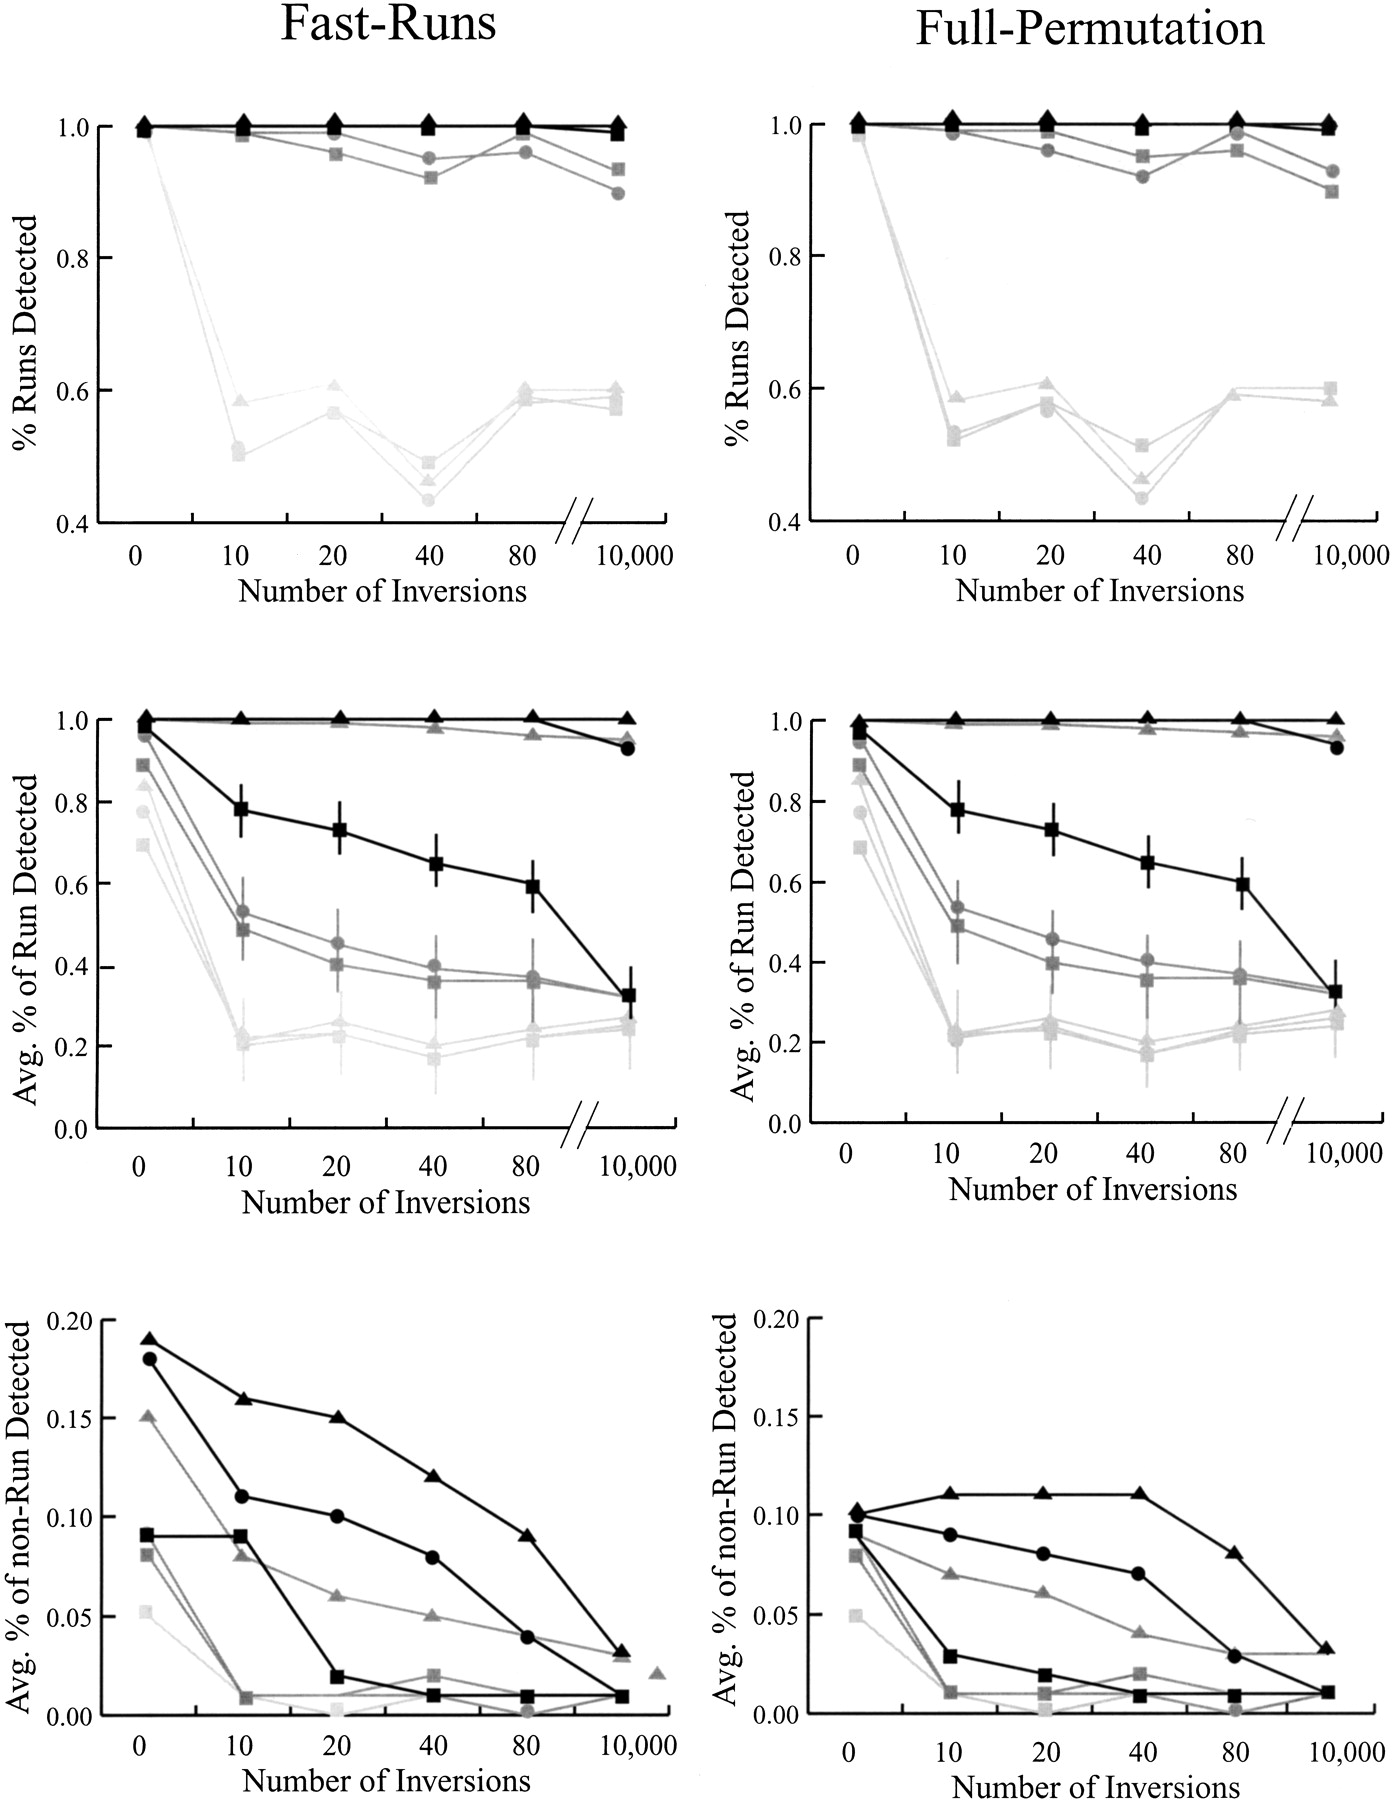
The power to detect simulated regions of chromosomal homology with the FastRuns and FullPermutation algorithms. (Top) The proportion of data sets in which some portion of the homologous region was detected. (Middle) The average proportion of the homologous region detected. (Bottom) The average proportion of the nonhomologous region detected. For all graphs, black lines represents results based on simulations in which 20 markers define the homologous region; dark gray, 10 markers; and light gray, five markers. The symbols represent analyses with different values of D: D = 2 (triangles); D = 1 (circles); and D = 0 (squares). Horizontal lines represent approximate standard deviations when available. The apparent dip in ability to identify a portion of the conserved region after 40 inversions (but not 80 or 10,000) disappears as the size of the simulated data set increases (data not shown).


