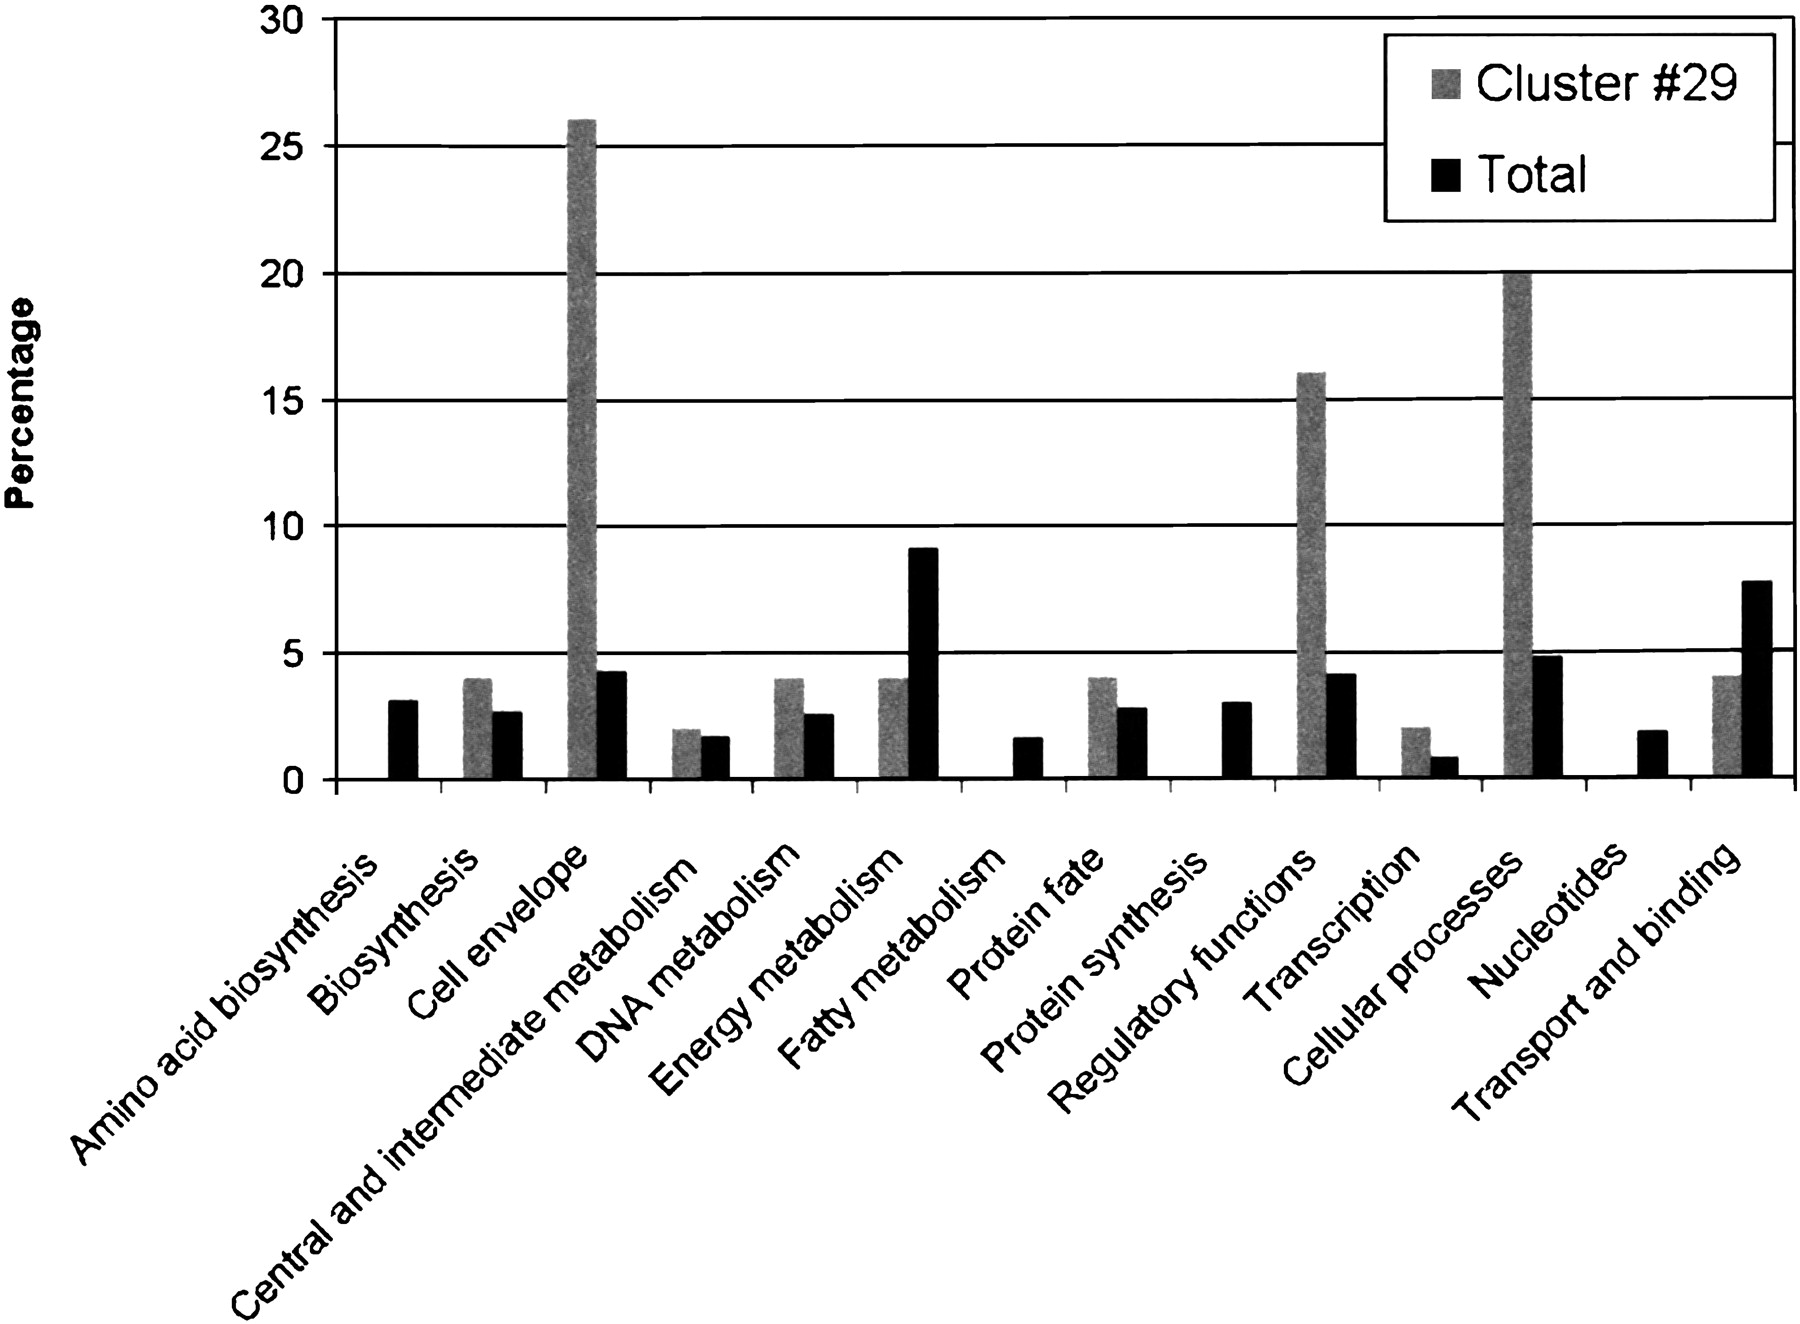
Comparing Bacterial Genomes Through Conservation Profiles

(Downloading may take up to 30 seconds. If the slide opens in your browser, select File -> Save As to save it.)

Click on image to view larger version.

Figure 4.
Figure 4.

Comparison of the GO terms corresponding to biological processes of the 50 proteins contained in cluster No. 29 with respect to the corresponding ones in the basal distribution of the rest of proteins.

This Article

  1. Genome Res. 13: 991-998

Preprint Server