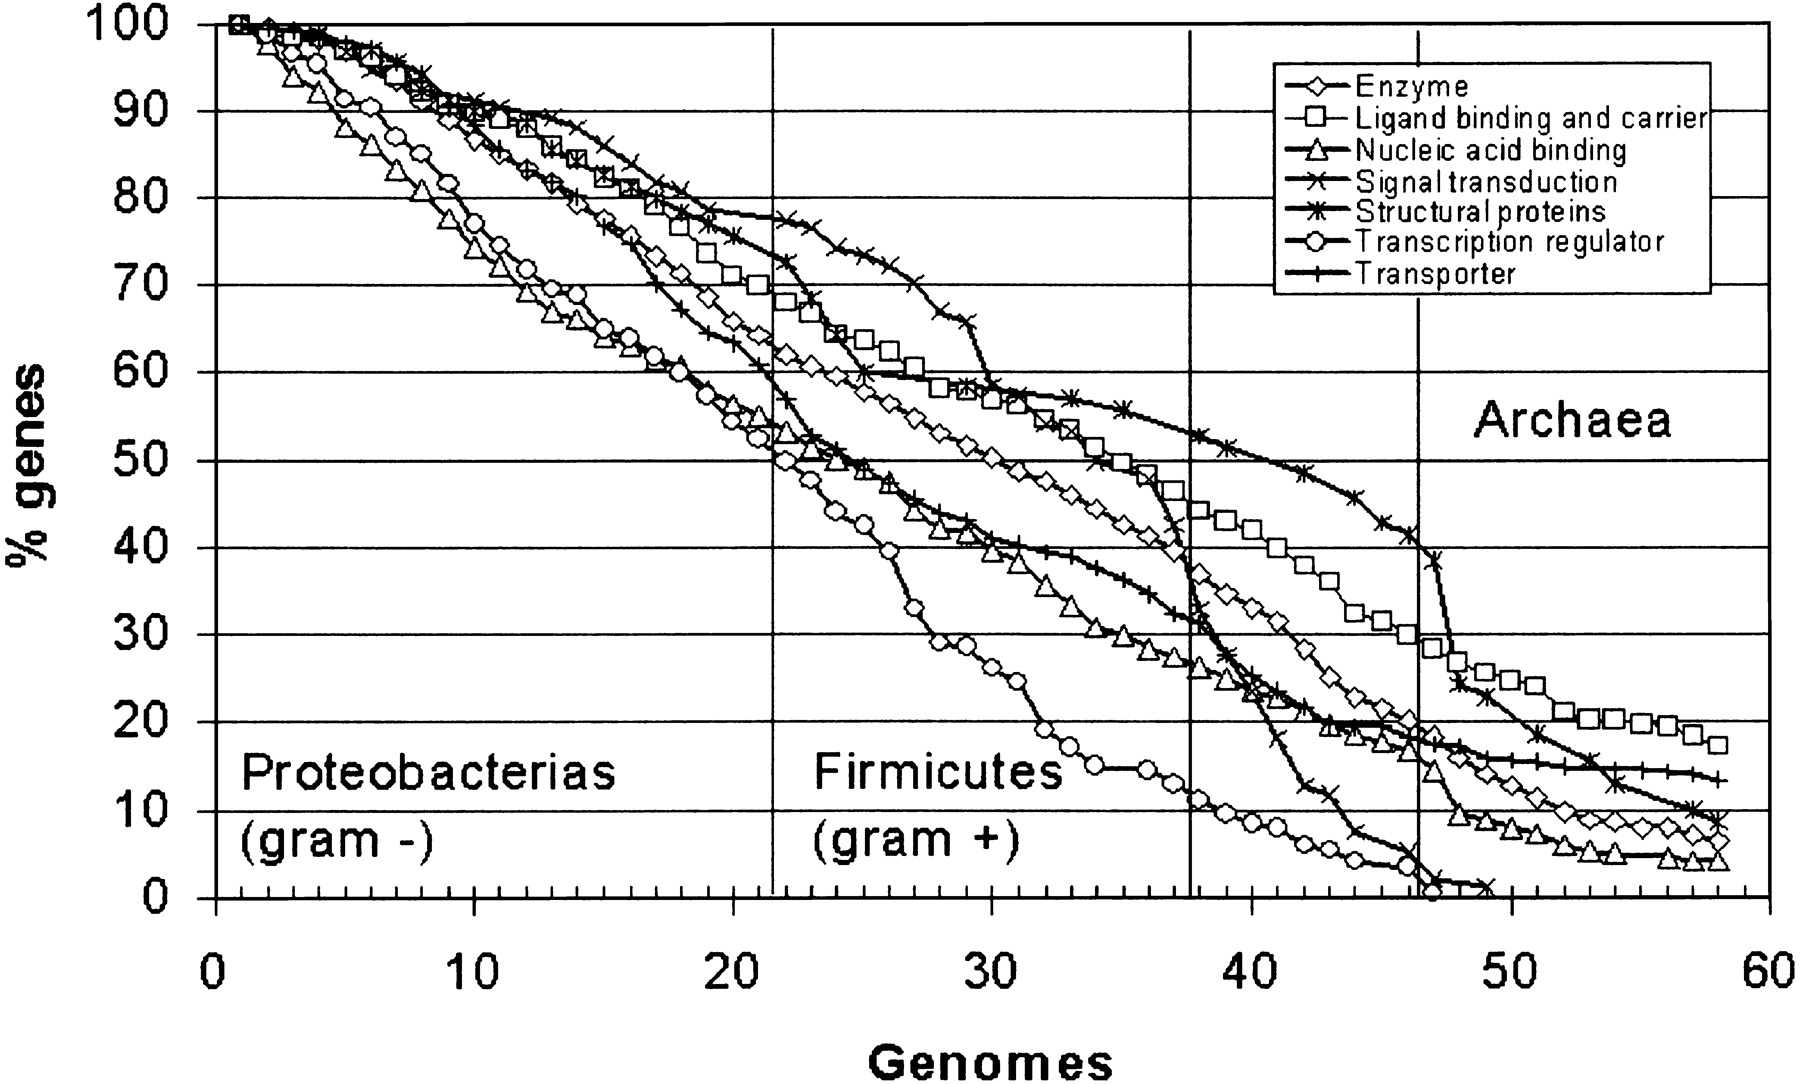
Comparing Bacterial Genomes Through Conservation Profiles

(Downloading may take up to 30 seconds. If the slide opens in your browser, select File -> Save As to save it.)

Click on image to view larger version.

Figure 3.
Figure 3.

Proportion Escherichia coli of genes labeled with different GO (Ashburner et al. 2000) biological processes, which are conserved across different genomes. Genomes in the horizontal axis are arranged as in Table 1.

This Article

  1. Genome Res. 13: 991-998

Preprint Server