
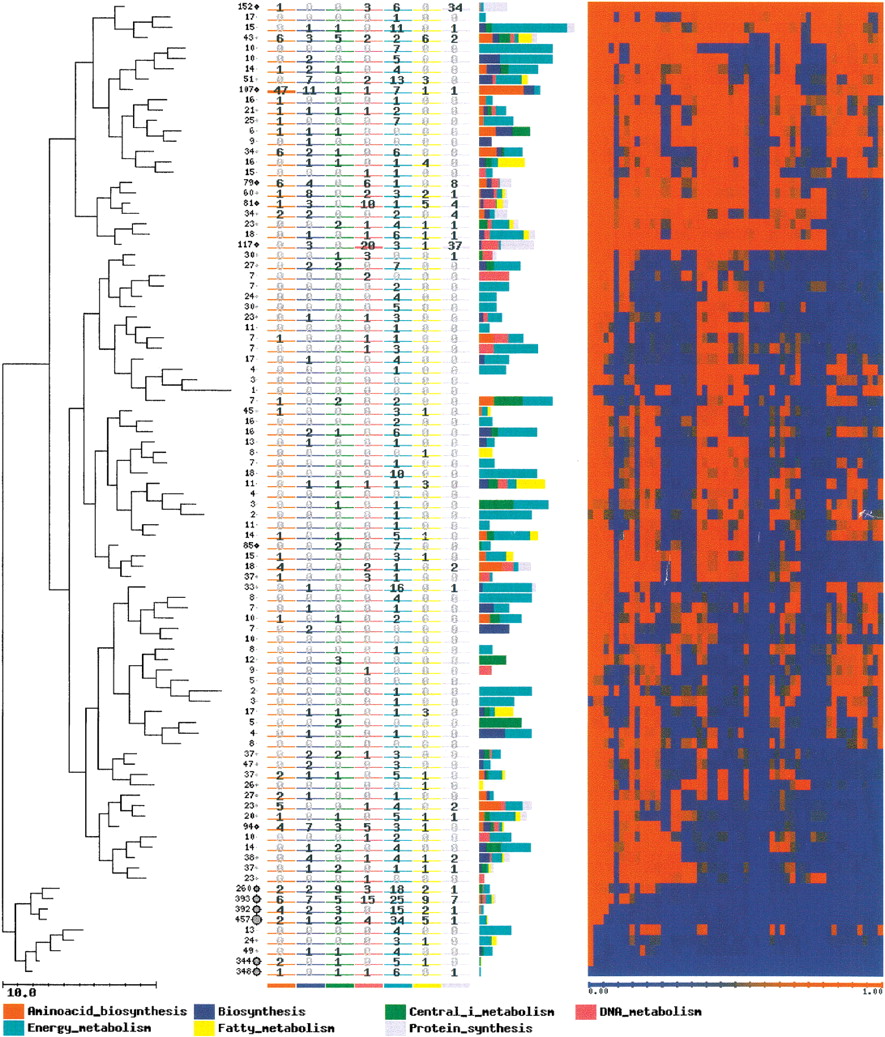
Clusters of homologous genes (CHGs) obtained upon the application of Self Organizing Tree Algorithm (SOTA) to the patterns of conservation of Escherichia coli genes after being transformed to presence/absence values. The value of variability used for the clustering process was of five. This means that patterns of conservation that appear in each cluster can have up to 10% of differences. The number in each leaf of the tree represents the number of genes in each cluster. Each column represents the number of genes annotated as members of one of the following TIGRFam families (Peterson et al. 2001): amino-acid biosynthesis; biosynthesis of cofactors, prosthetic groups, and carriers; central and intermediate metabolism; DNA metabolism; energy metabolism; fatty-acids metabolism and protein synthesis. Labels corresponding to the TIGR families are represented for the different clusters. They indicate the proportion of genes labeled with the different terms in each cluster. Each column in the heat map (right) represents one of the genomes in the same order as they appear in Table 1. A full color figure can be seen in the additional information Web pagehttp://bioinfo.cnio.es/data/GenomeProfile/.


