
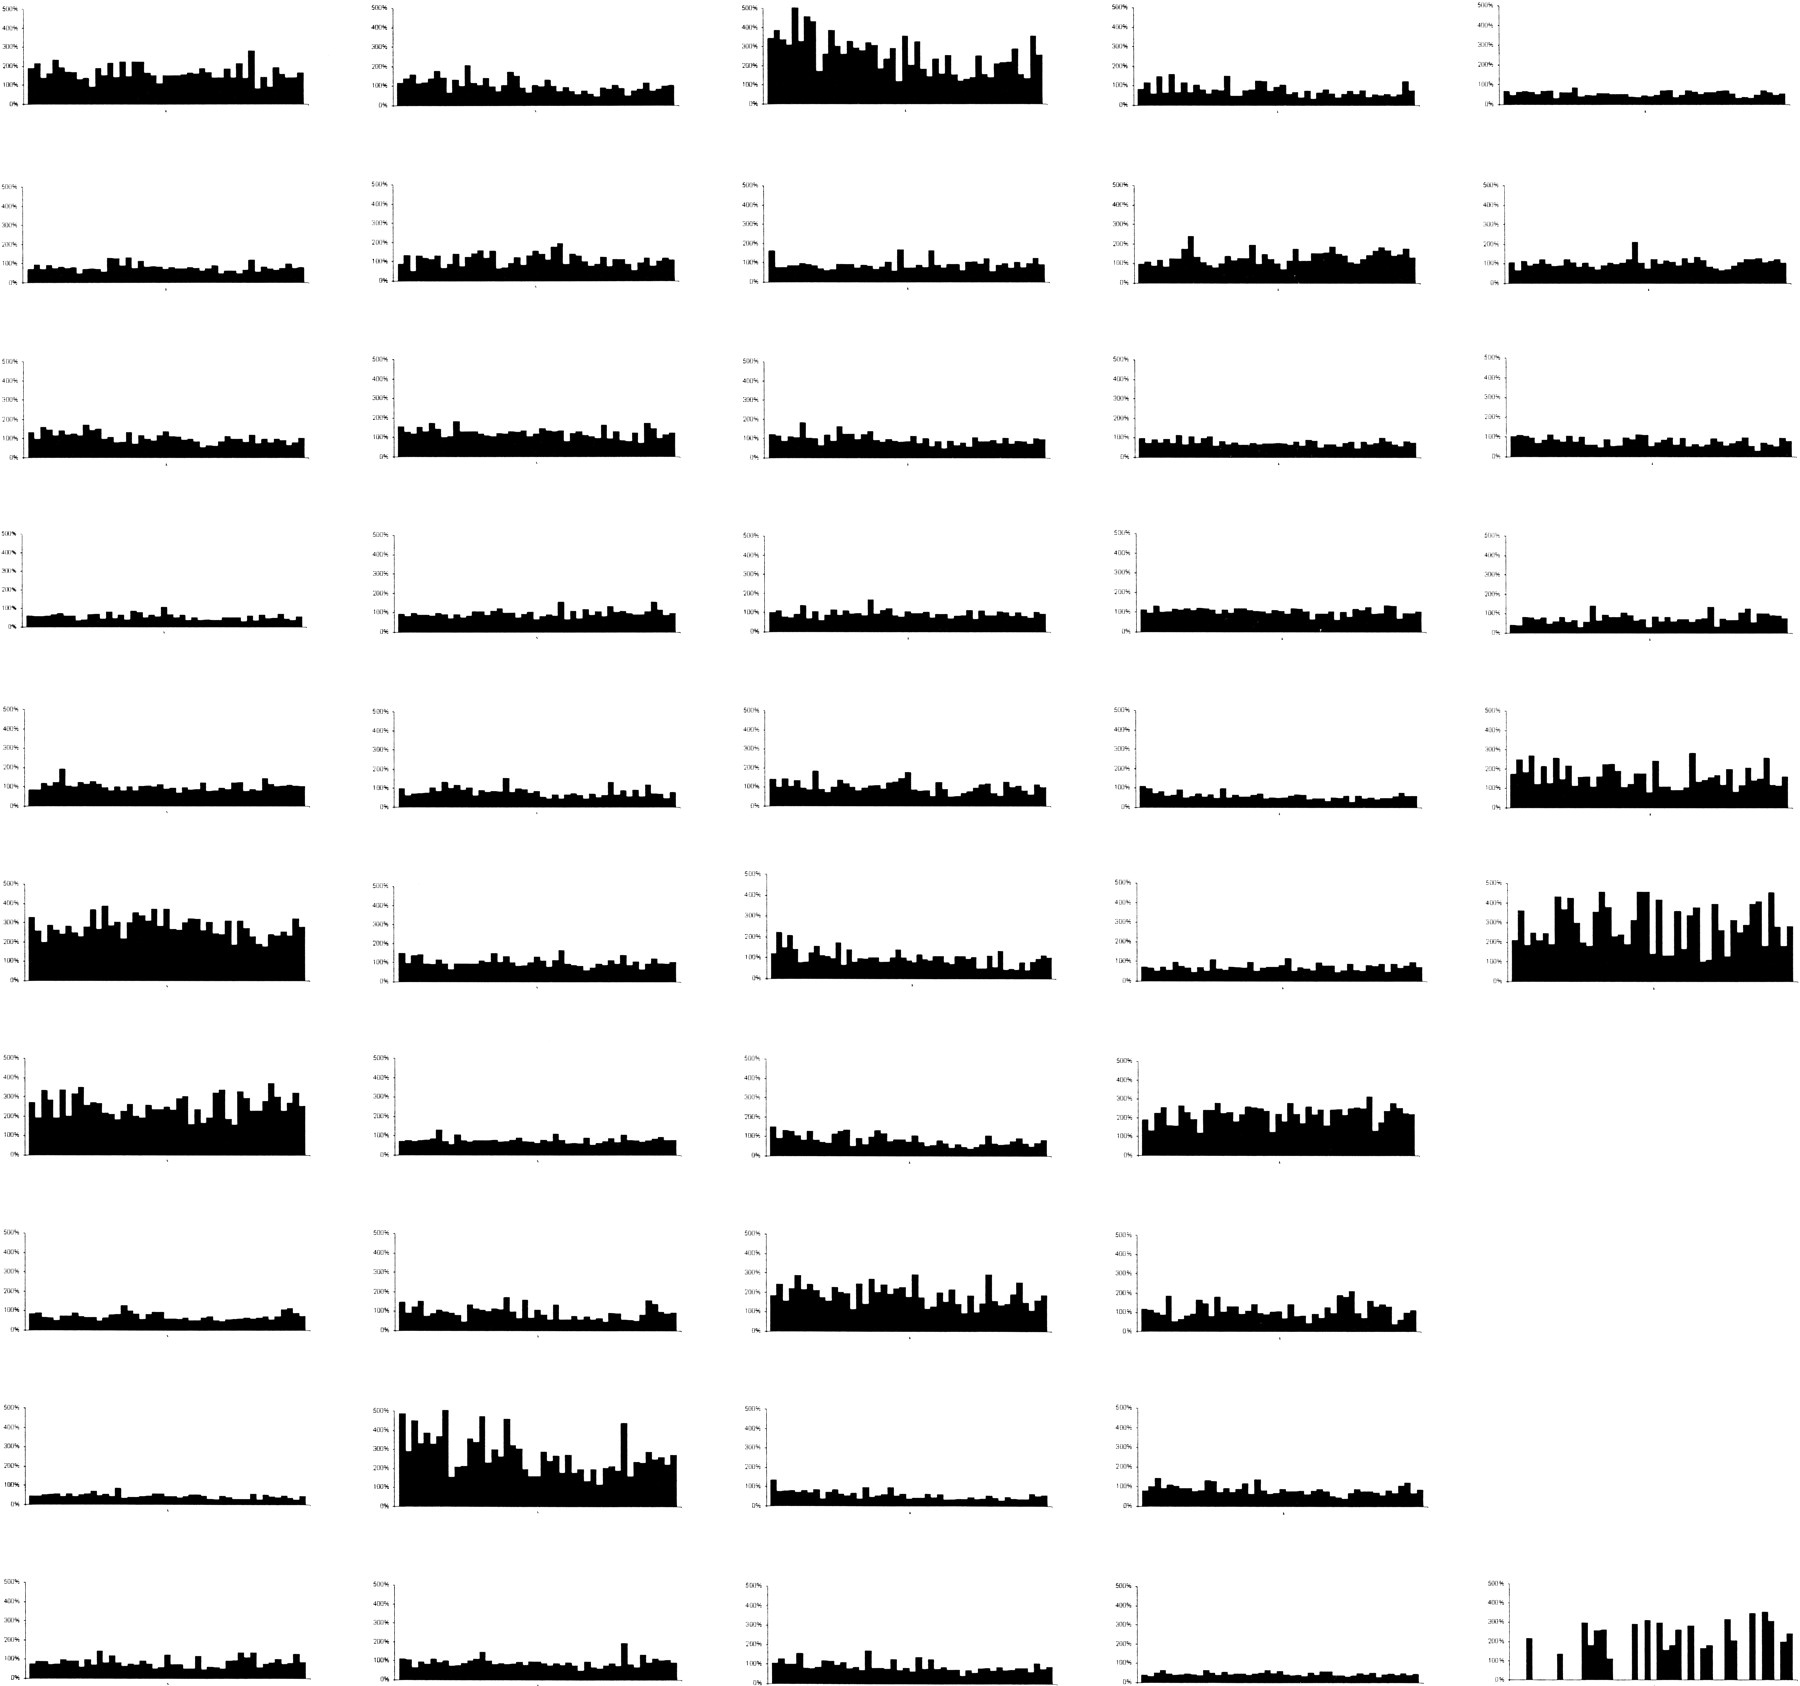
Figure 3.
Histograms of loci representations for 47 genetic Loci and 44 DNA samples. Each graph is for a different locus, with each bar representing one of the 44 DNA samples. The loci representation for the Y-chromosome-specific sex determining region gene (SRY) is depicted in the bottom right-hand corner.


