
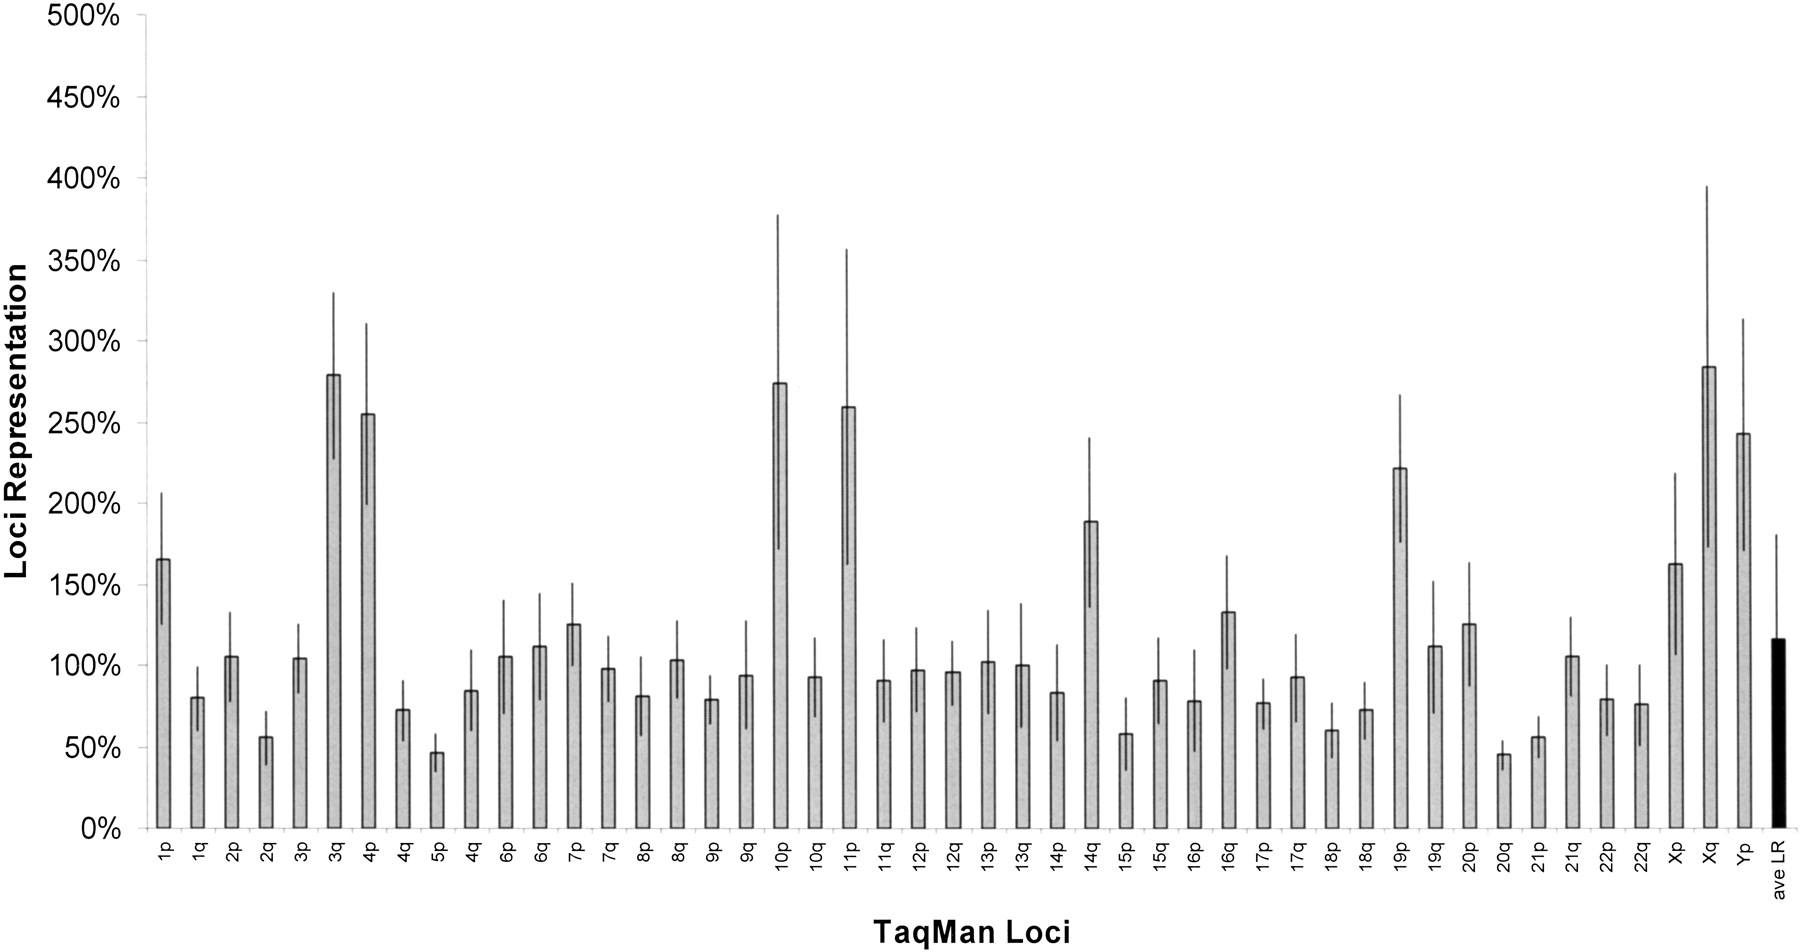
Figure 2.
Amplification bias analysis by the TaqMan assay for 47 human loci. The location on the chromosome for the 47 loci tested from the WIAF (Whitehead Institute-Affymetrix) SNPs database (http://www-genome.wi.mit.edu/snp/human/) is in Table 1. Loci representation relative to the starting DNA template for each of the 47 loci. Each bar represents the average loci representation of 44 patients. The average of all of the 47 loci was 117% (black bar).


