
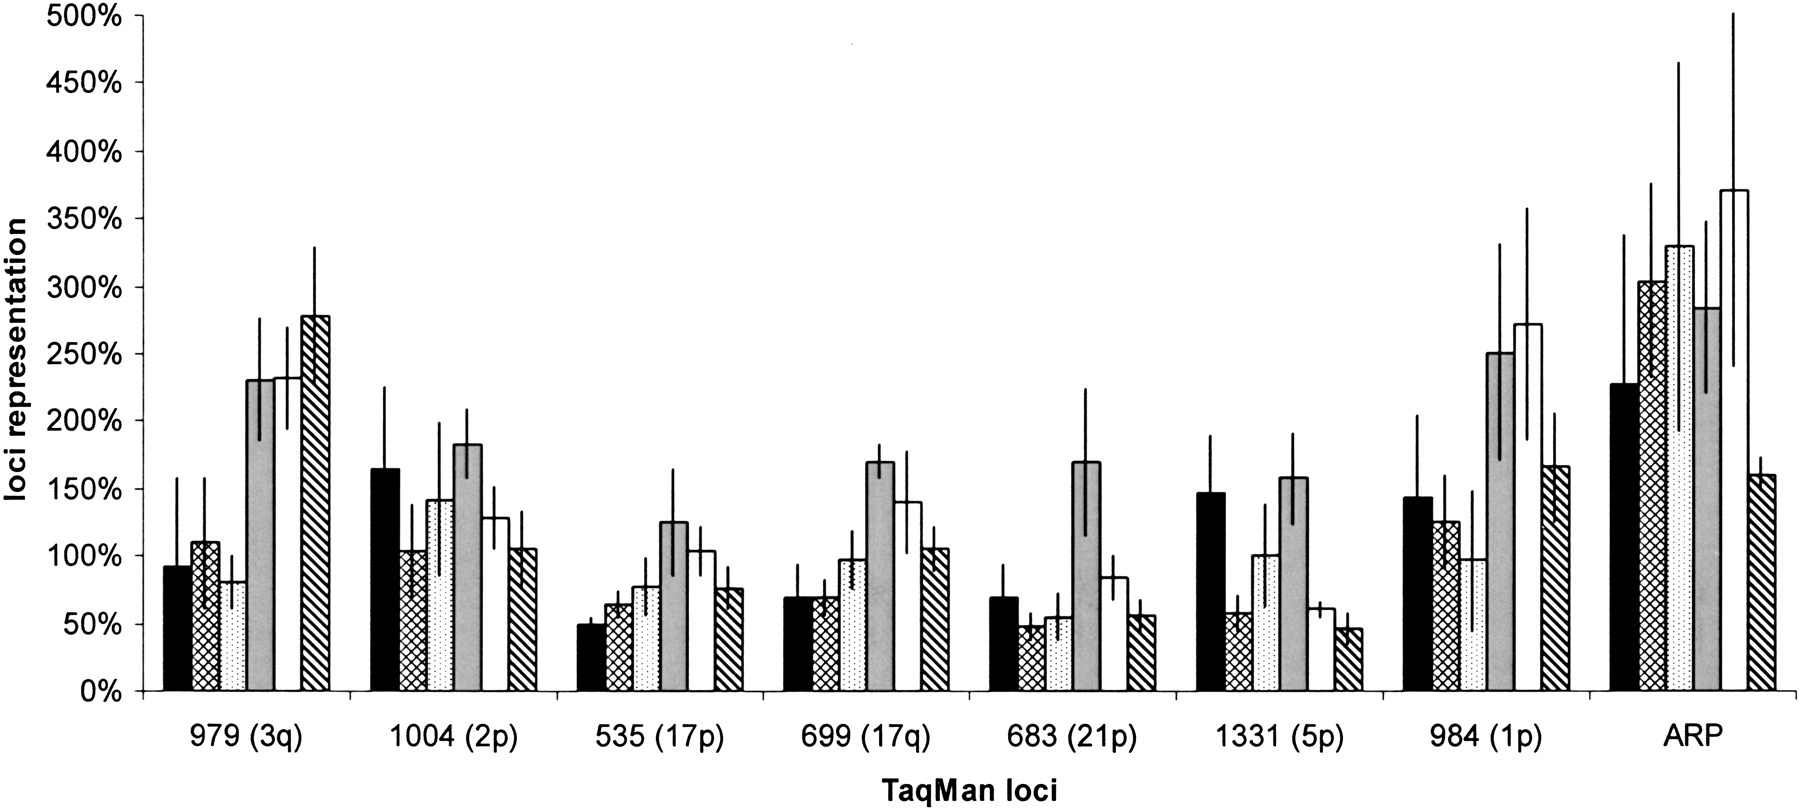
Figure 1.
Comparison of MDA carried out from biological samples. Eight loci were examined for representation by the TaqMan assay. (Buccal swab) Black bars; (whole blood) cross-hatched bars; (finger stick) dotted bars; (buffy coat) gray bars; (Guthrie card) white bar; (control genomic DNA) diagonal-hatched bar. For buccal swab, whole blood, and finger stick blood, the error bar representing 1 SD was generated from the average of 20 different individual MDA amplifications. For buffy coat and Guthrie card, the error bar representing 1 SD was generated from the average of 6 different individual MDA amplifications.


