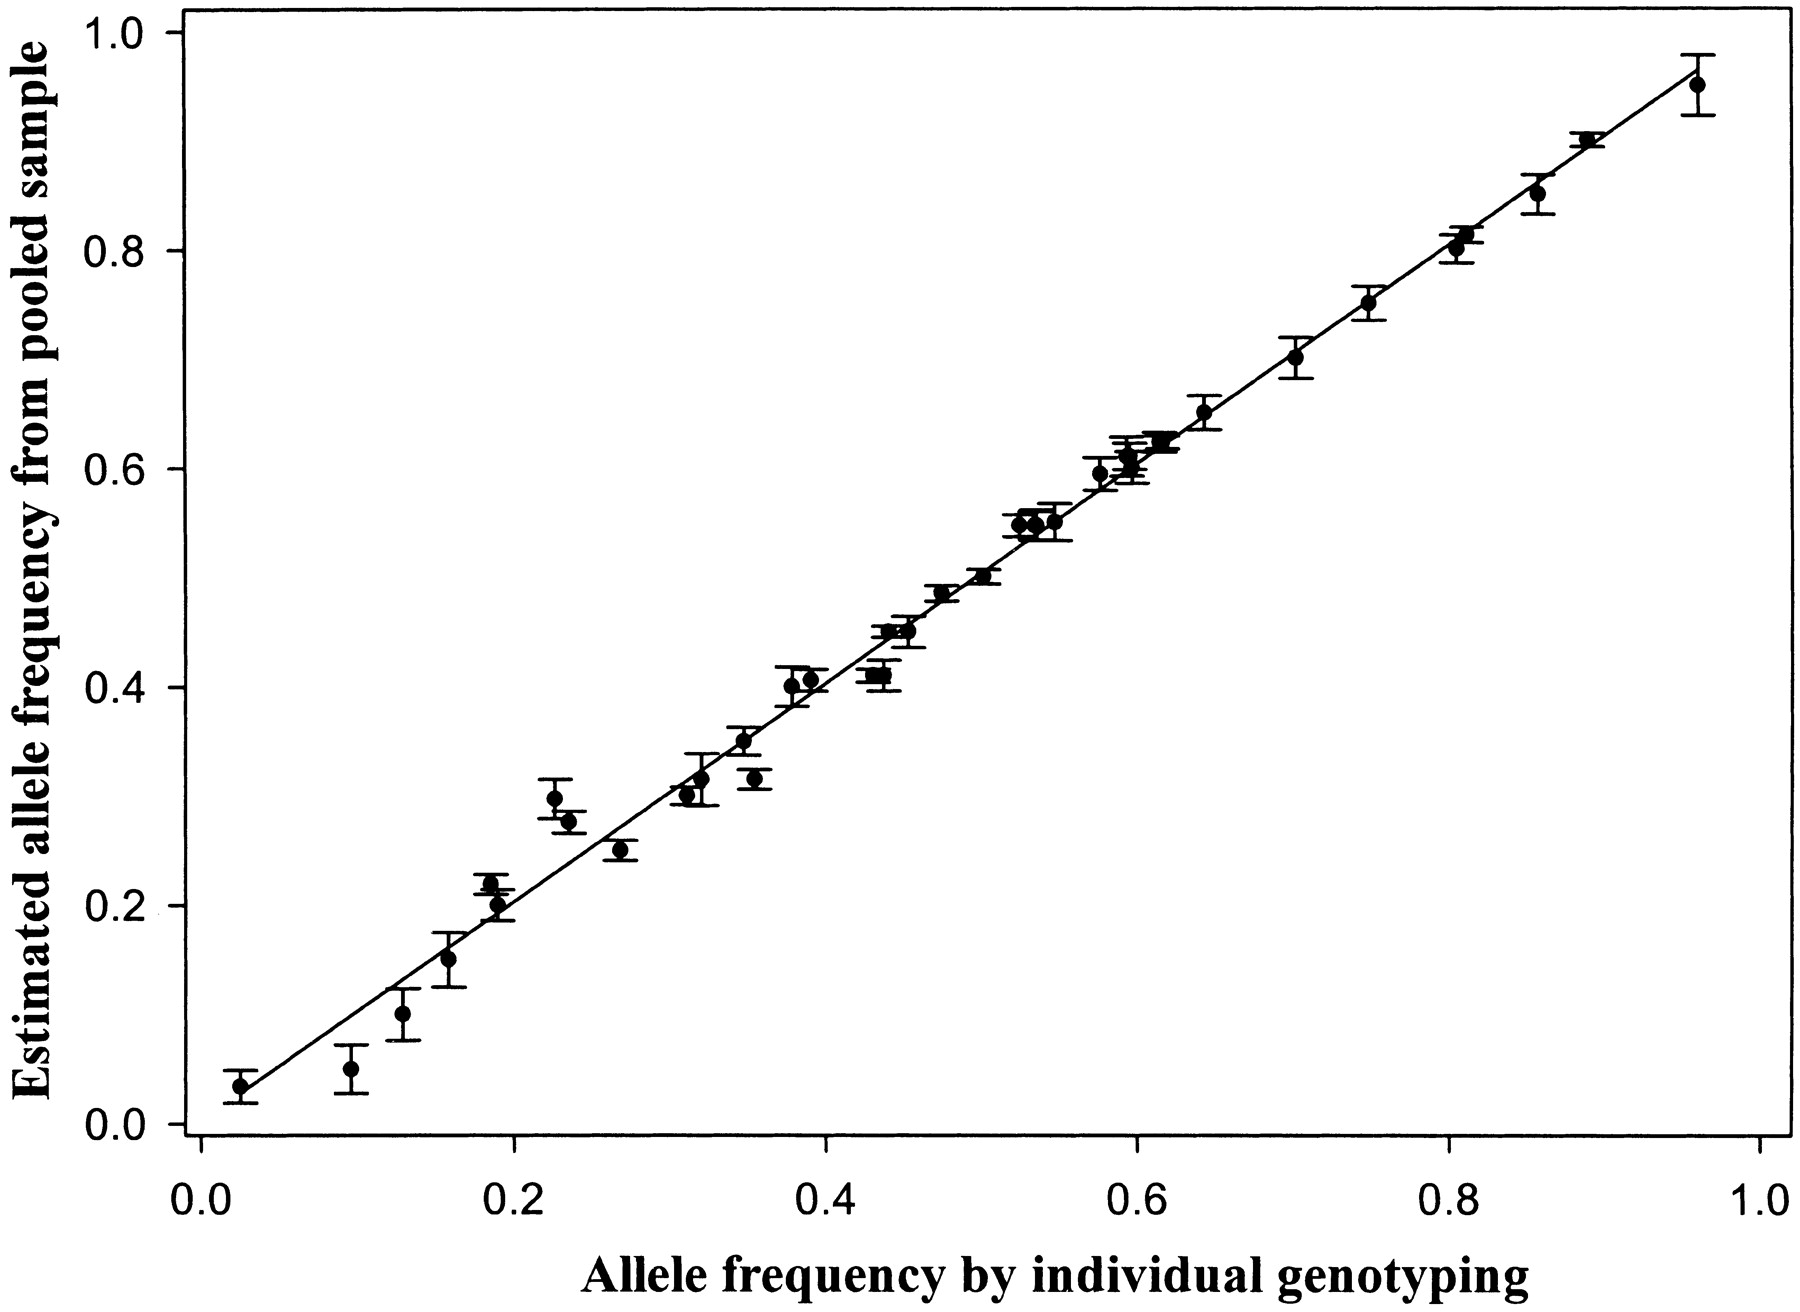
DNA Analysis by Fluorescence Quenching Detection

(Downloading may take up to 30 seconds. If the slide opens in your browser, select File -> Save As to save it.)

Click on image to view larger version.

Figure 5.
Figure 5.

Allele frequency measurements in pools (y-axis) vs. allele frequency obtained by genotyping individuals (x-axis). A linear relation was observed with r2 = 0.993, slope = 1.002 (P < 0.0001).

This Article

  1. Genome Res. 13: 932-939

Preprint Server