
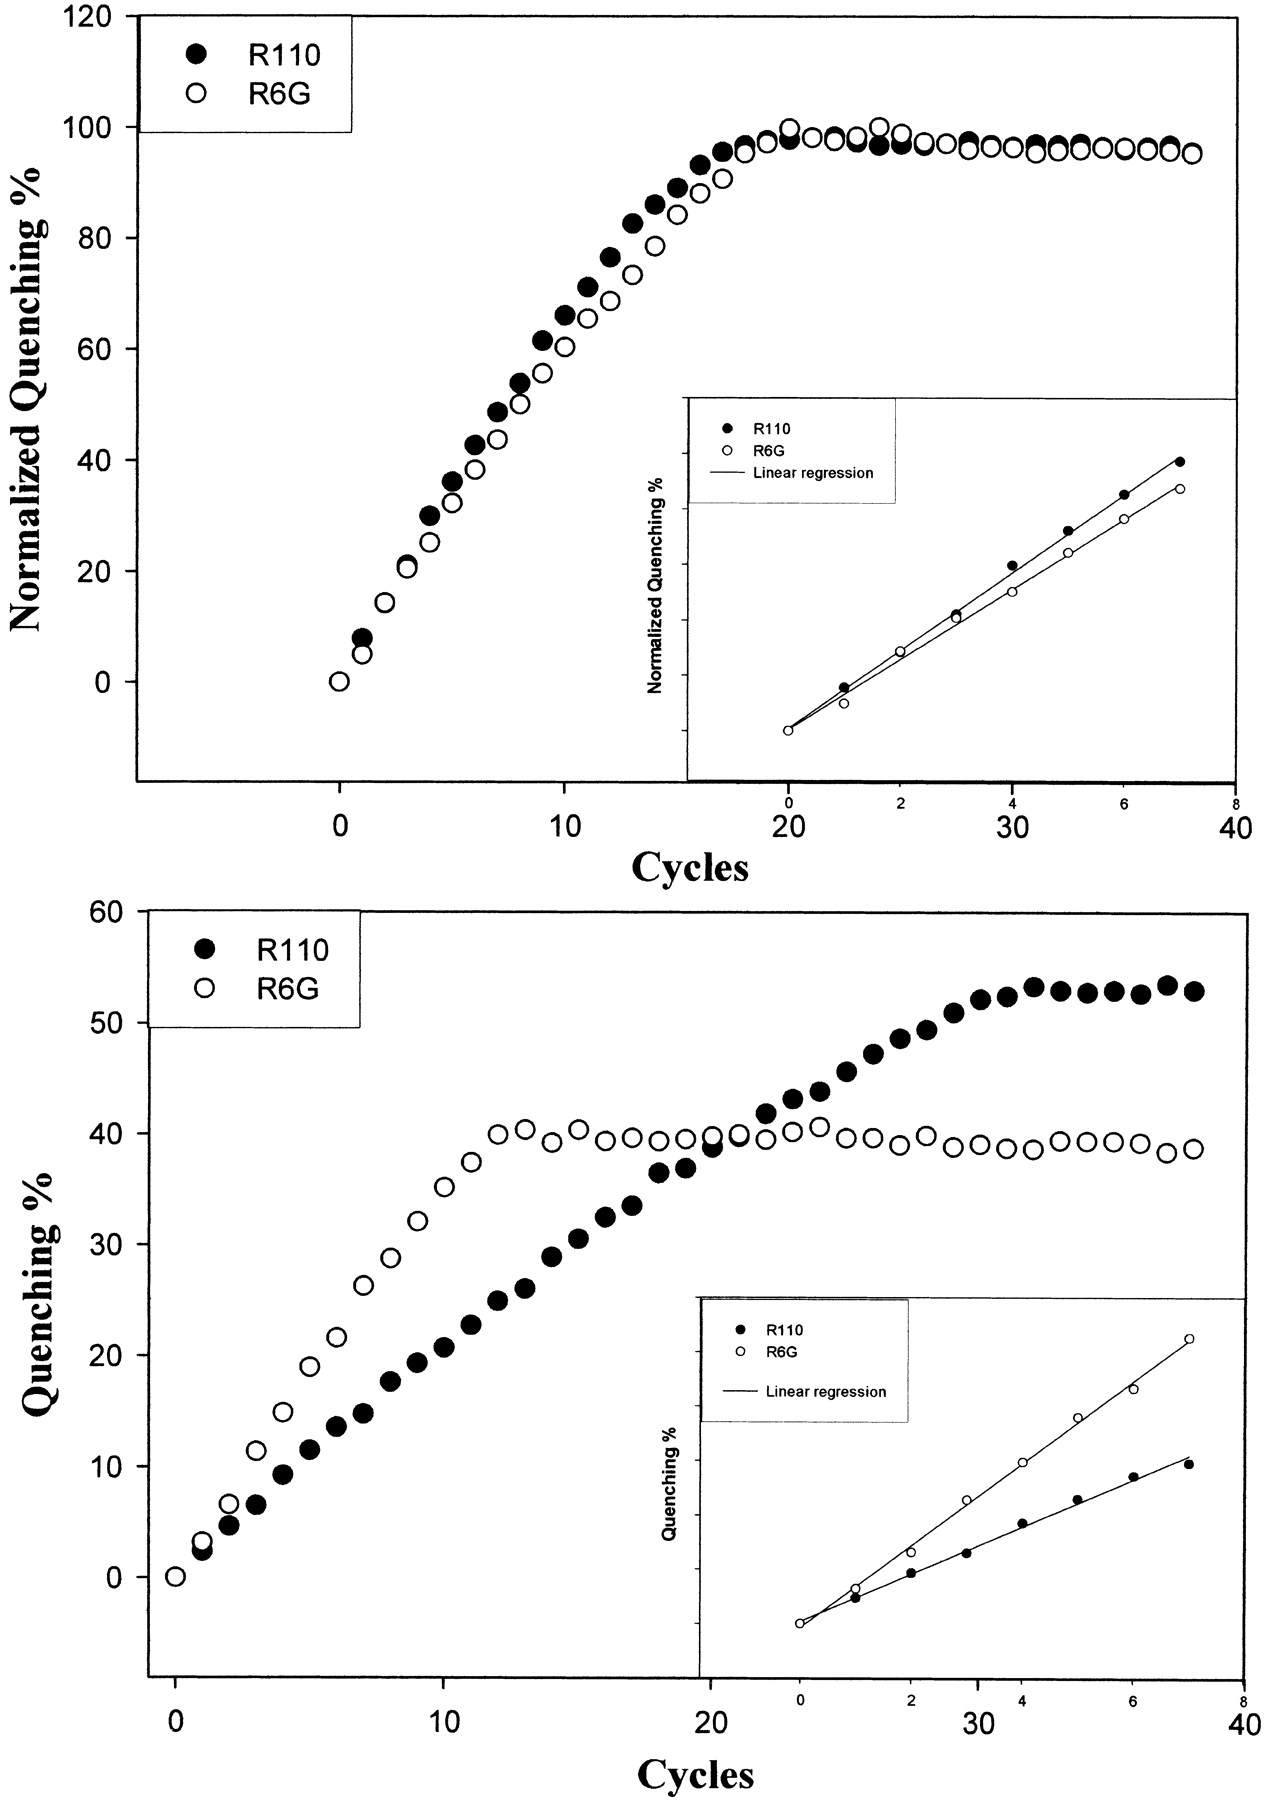
Figure 3.
The basis of determining allele frequency for pooled DNA samples. Thetop panel is a normalized real-time quenching curve for a heterozygous sample of rs922365. The linear regression of the first eight cycles is shown in the inset. The bottom panel is the quenching curve for a mixture containing 75% A allele.


